
FIGURE 7.
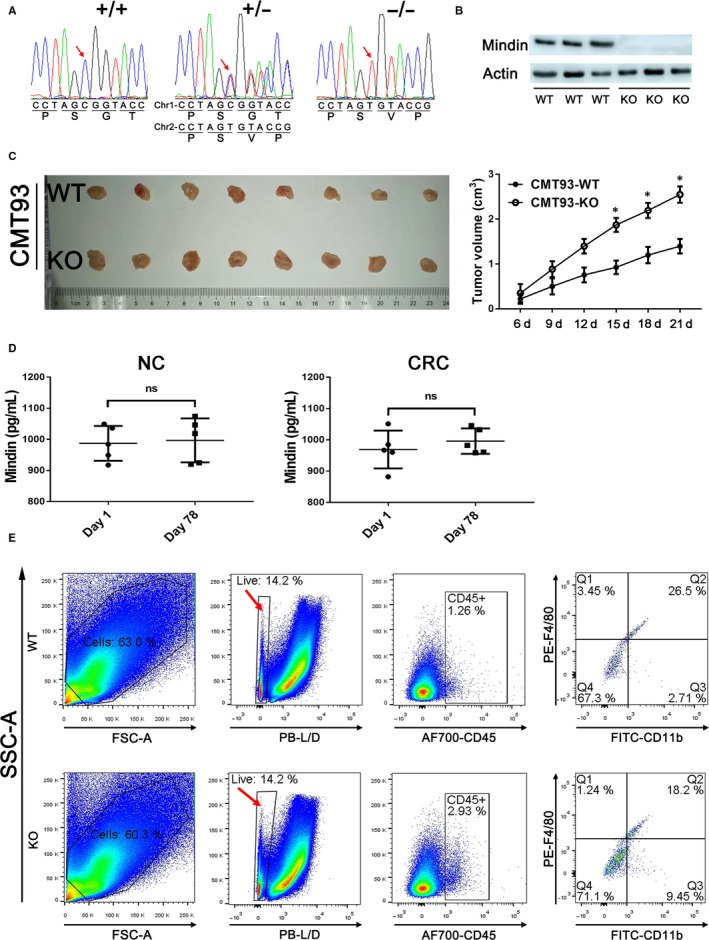
A, Sequencing chromatograms show the nucleotide mutation of mindin−/− mice using a CRISPR‐Cas system. B, Western blot analysis using antibody against mindin on mice colon tissues. Actin was used as a loading control. C, The tumour images of 21 d after subcutaneous injection of CMT93 colorectal cancer cells in mindin‐knockout and the control mice. Tumour size was measured and quantitatively analysed (n = 5, *P < 0.05). D, Mindin expression was measured by ELISA in the first day and the end point of the model in WT mice serum with or without CRC procedure. E, The cells were isolated from tumour tissues of the AOM/DSS‐induced CRC mice. The procedure of flow cytometry analysis as follows: gated the single cells first, separated cells with the LIVE/DEAD dye and gated the CD45+ cells, then right panels showed the FITC‐CD11b and PE‐F4/80‐stained cells