Figure 5.

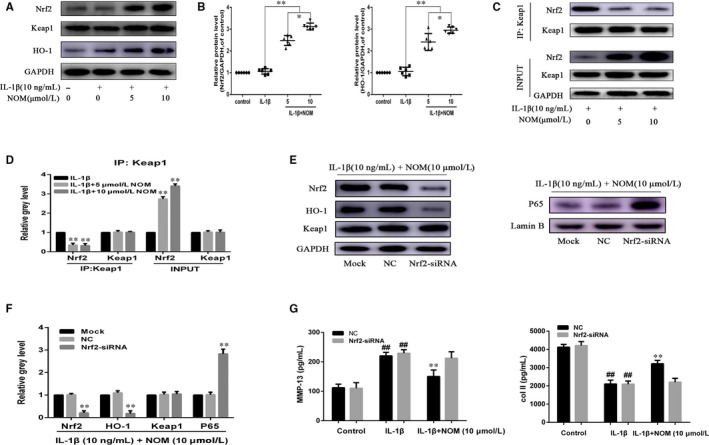
Effect of NOM on Keap1‐Nrf2 pathway. Chondrocytes were pre‐treated for 1 h with various concentrations of NOM (0, 5 and 10 μmol/L), followed by stimulation with or without IL‐1β (10 ng/mL) for 2 h. Nrf2, Keap1 and HO‐1 were determined by Western blot (A) and quantification analysis (B). Total proteins extracted were subjected to immunoprecipitation (IP) using specific antibodies against Keap1. Immunoprecipitates were then subjected to Western blot analyses using specific antibodies against Keap1 and Nrf2 (C). Quantitative analyses of immunoprecipitates relative to GAPDH by densitometry were conducted (D). After Nrf2 knock‐down, the protein expressions of Nrf2, HO‐1 and P65 in chondrocytes treated as above were visualized by Western blot (E) and quantified in (F). The production of MMP‐13 and collagen II was assessed by ELISA (G). The values are mean ± SD of five independent experiments. **P < .01 compared with IL‐1β group. *P < .05 compared with NOM (5 μmol/L) group. NS compared with NOM (5 μmol/L) group
