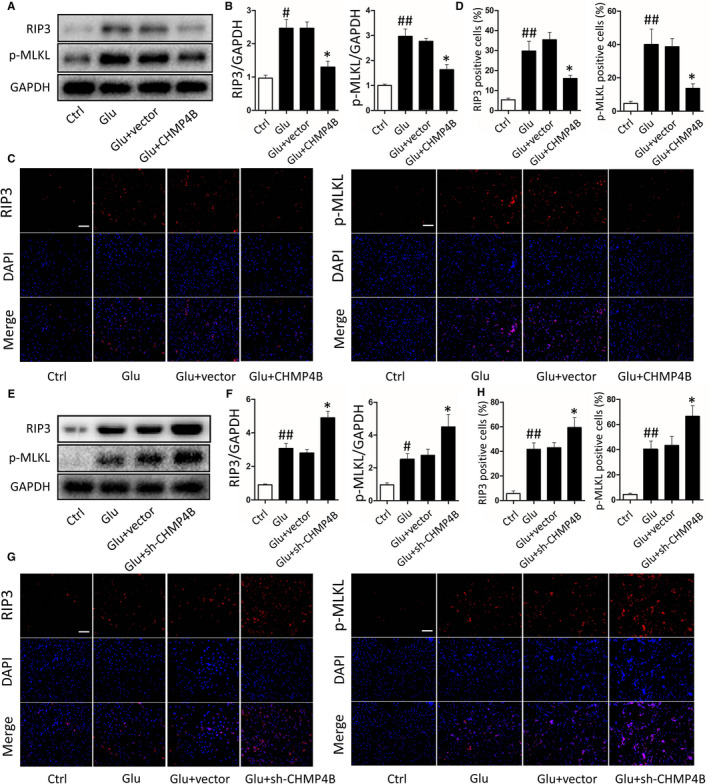
FIGURE 4.

Effects of CHMP4B on necroptosis in BV2 cells. There are four treatment groups take part in the experiments: control, Glu, Glu + vector, Glu + CHMP4B (#P: Glu groups compared with Ctrl groups; *P: Glu + CHMP4B groups compared with the Glu + vector groups). A, Protein levels of RIP3 and p‐MLKL. GAPDH was used as the loading control. B, Bar graphs show the results of analysis (by band density analysis) of RIP3 and p‐MLKL (n = 3; data are presented as the means ± SEM). C, Immunofluorescence of RIP3 and p‐MLKL (scale bar = 150 μm). D, Statistical analysis of the positive cells shown in C (n = 3; data are presented as the means ± SEM). There are four treatment groups take part in the experiments: control, Glu, Glu + vector, Glu + sh‐CHMP4B (#P: Glu groups compared with Ctrl groups; *P: Glu + sh‐CHMP4B groups compared with the Glu + vector groups). E, Protein levels of RIP3 and p‐MLKL. GAPDH was used as the loading control. F, Bar graphs show the results of analysis (by band density analysis) of RIP3 and p‐MLKL (n = 3; data are presented as the means ± SEM). G, Immunofluorescence of RIP3 and p‐MLKL (scale bar = 150 μm). H, Statistical analysis of the positive cells shown in G (n = 3; data are presented as the means ± SEM). *P < .05; #P < .05; ##P < .01
