Figure 1.

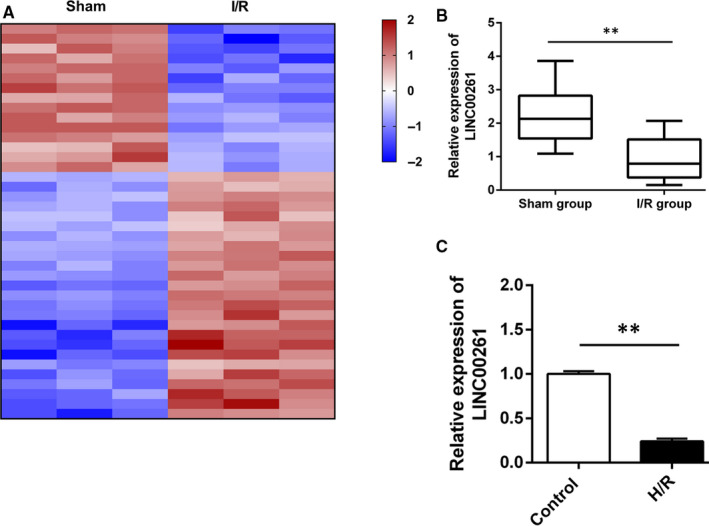
LncRNAs expression profiles in I/R myocardium model exposed an significantly down‐regulated lncRNA, LINC00261. (A) Heatmaps show the differentially expressed transcripts in rats I/R group and sham group. Blue represents a lower fold‐change and red represents a higher fold‐change, n = 3. (B) qRT‐PCR verified the low expression level of LINC00261 in I/R myocardium, n = 7. (C) Relative expression of LINC00261 in H/R H9C2 cell **P<0.01, n = 3
