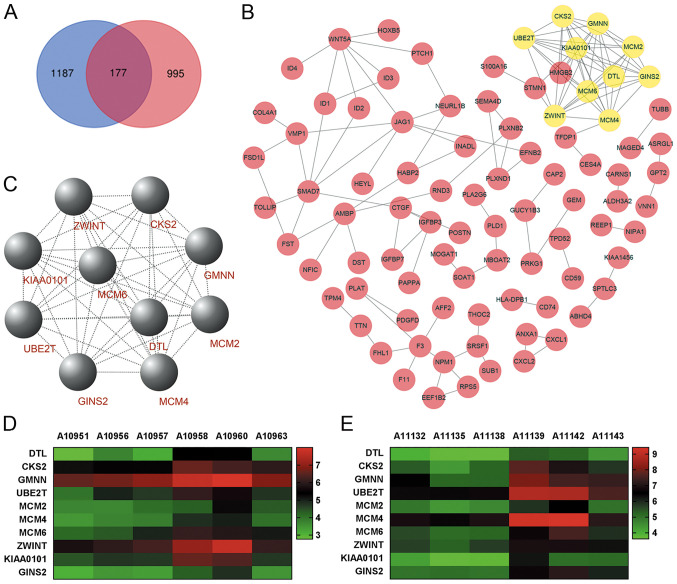
Figure 2.
PPI network and the key modules of DEGs. (A) Intersection between three pairs of DEGs with FC>1.5 and P<0.05 (gallbladder tumor walls vs. gallbladder adenoma walls), and three pairs of DEGs with |FC|>2 and P<0.05 (gallbladder tumor tissues vs. gallbladder adenoma tissues). For microarray analysis, gallbladder adenoma was used as the control. Blue represents DEGs in gallbladder tumor walls and pink represents DEGs in gallbladder adenoma walls. (B) PPI network of 177 DEGs was constructed using Cytoscape software. In the PPI network, each node represents a protein and each edge represents a PPI. (C) DEGs with degrees ≥10 were selected from the PPI network as the hub genes for the key modules. Hierarchical clustering analysis of the hub genes in the datasets, (D) three pairs of gallbladder tumor walls vs. gallbladder adenoma walls and (E) three pairs of gallbladder tumor tissues vs. gallbladder adenoma tissues. A10951, A10956 and A10957; gallbladder adenoma wall samples; A10958, A10960 and A10963, gallbladder tumor wall samples; A11132, A11135 and A11138; gallbladder adenoma tissue samples; A11139, A11142 and A11143, gallbladder tumor tissue samples. PPI, protein-protein interaction; DEG, differentially expressed gene; FC, fold-change.

