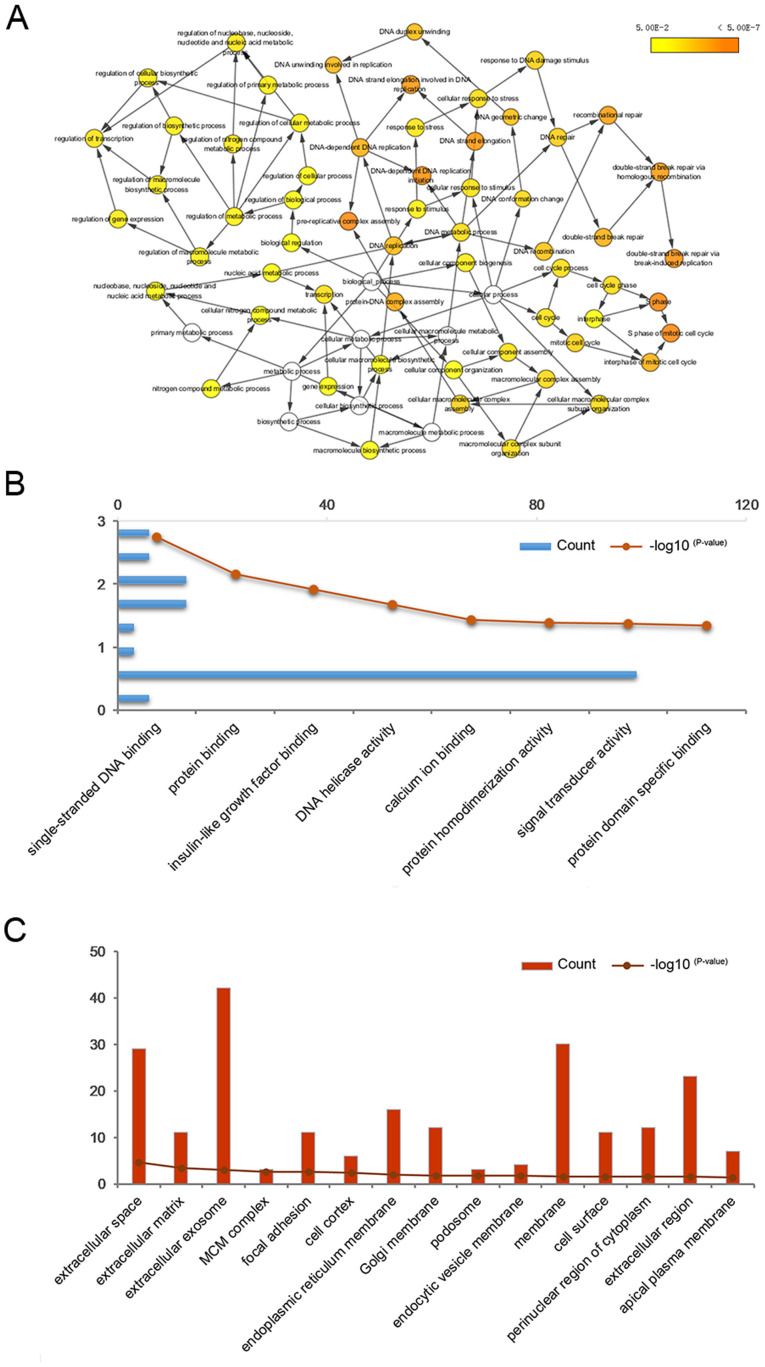
Figure 3.
Biological processes and GO analysis of the hub genes. (A) A network of biological processes associated with the hub genes was constructed using the Biological Network Gene Ontology tool. The node color is associated with the adjusted p-value. P<0.01 was considered to indicate significantly enriched processes. GO analysis, including (B) molecular function and (C) cell component was performed using the Database for Annotation, Visualization and Integrated Discovery. GO, Gene Ontology.

