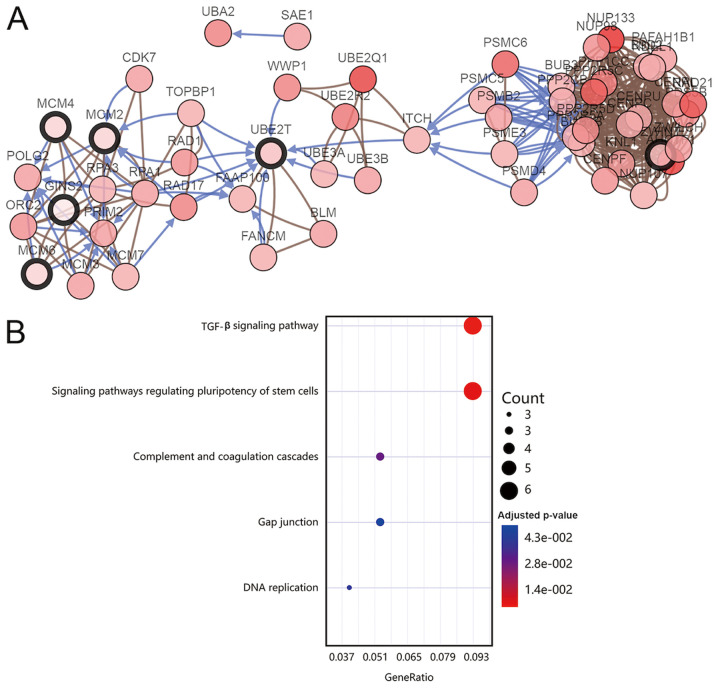
Figure 4.
Co-expression network and KEGG pathway analysis of the hub genes. (A) A co-expression network was constructed using cBioPortal. Nodes with bold black outline represent the hub genes, while nodes with thin black outline represent the co-expressed genes. (B) KEGG pathway analysis of the hub genes was performed using the Database for Annotation, Visualization and Integrated Discovery. KEGG, Kyoto Encyclopedia of Gene and Genomes.

