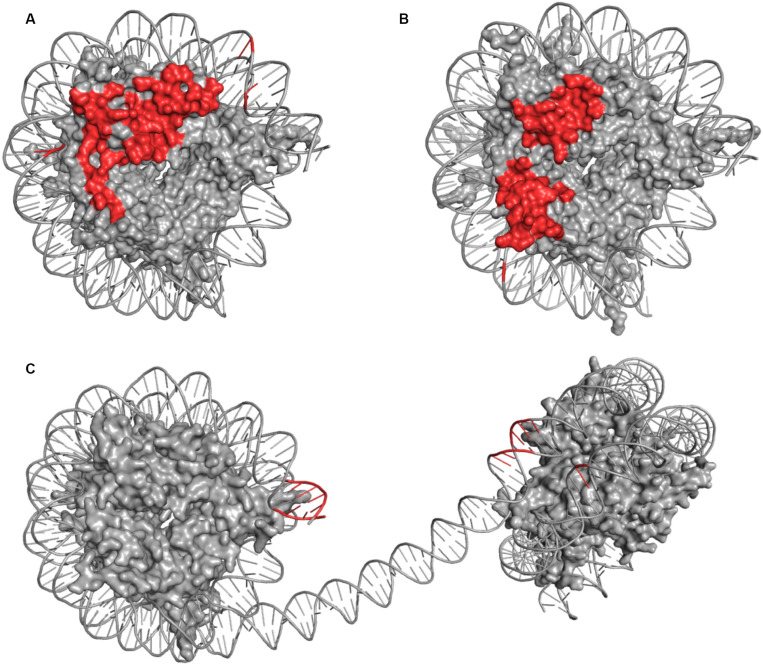
FIGURE 4.
Comparison of DOT1L (A), COMPASS (B), and mPRC2 (C) Modes of Engagement with the Nucleosome. The nucleosome discs represent NCP structures captured in the same orientations. The side-by-side comparison shows surface representation of histones inside the nucleosome disc (gray) and cartoons depiction of DNA (gray) highlighting amino acids or DNA bases which come to close contact (≤5 Å) with residues of the associated enzyme or enzyme complex (red). Contact points involving histone tails were omitted due to lack of structural continuity.

