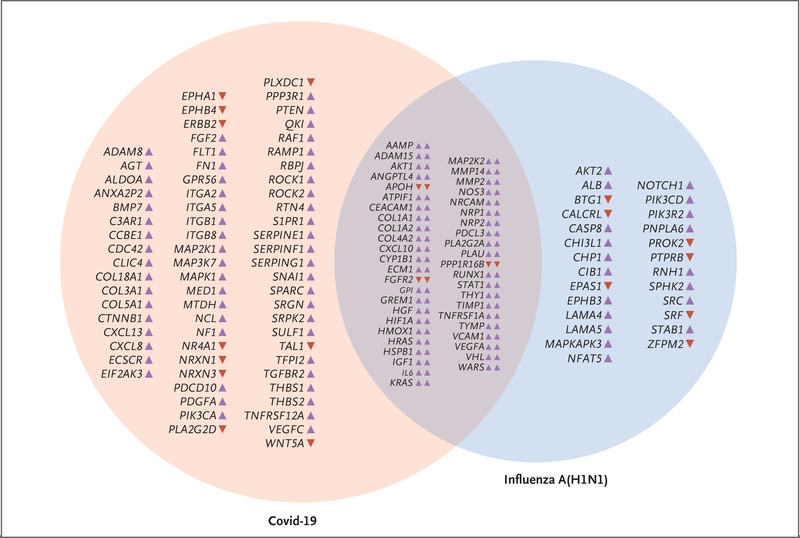
Figure 5. Relative Expression Analysis of Angiogenesis-Associated Genes in Lungs from Patients Who Died from Covid-19 or Influenza A(H1N1).
RNA was isolated from sections sampled directly adjacent to those used for complementary histologic and immunohistochemical analyses. RNA was isolated with the Maxwell RNA extraction system (Promega) and, after quality control through Qubit analysis (ThermoFisher), was used for further analysis. During the NanoString procedure, individual copies of all RNA molecules were labeled with gene-specific bar codes and counted individually with the nCounter Analysis System (NanoString Technologies). The expression of angiogenesis-associated genes was measured with the NanoString nCounter PanCancer Progression panel (323 target genes annotated as relevant for angiogenesis). The resulting gene-expression data were normalized to negative control lanes (arithmetic mean background subtraction), positive control lanes (geometric mean normalization factor), and all reference genes present on the panel (geometric mean normalization factor) with the use of nSolver Analysis Software, version 4.0. Shown in the Venn diagram are only genes that are statistically differentially expressed as compared with expression in controls in both disease groups (Student’s t-test, controlled for the familywise error rate with a Benjamini–Hochberg false discovery rate threshold of 0.05). Up-regulation and down-regulation of genes is indicated by colored arrowheads suffixed to the gene symbols (purple denotes up-regulation, red denotes down-regulation).

