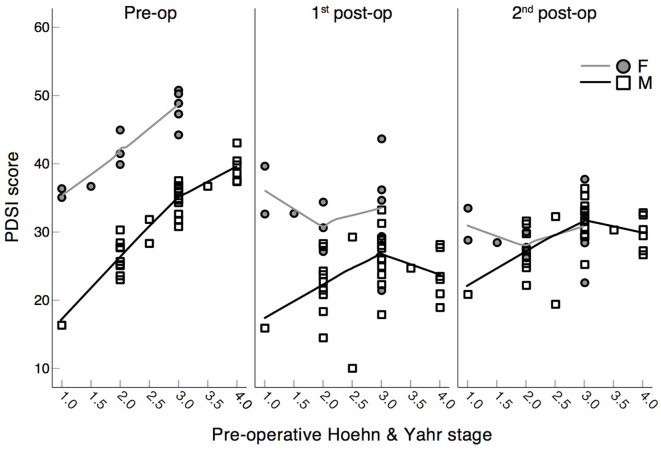
Figure 5.
Scatter plots of PDSI scores (PDQ-39) and pre-operative Hoehn & Yahr stage. Assessment of scores in PD patients at the three experimental stages: pre-operation, 1st post-operation, 2nd post-operation separated by sex: F = female, M = male. Higher PDSI scores correspond to a worse QoL. Lines represent Loess fit lines with 99% proportion of data points and Epanechnicov's kernel function.

