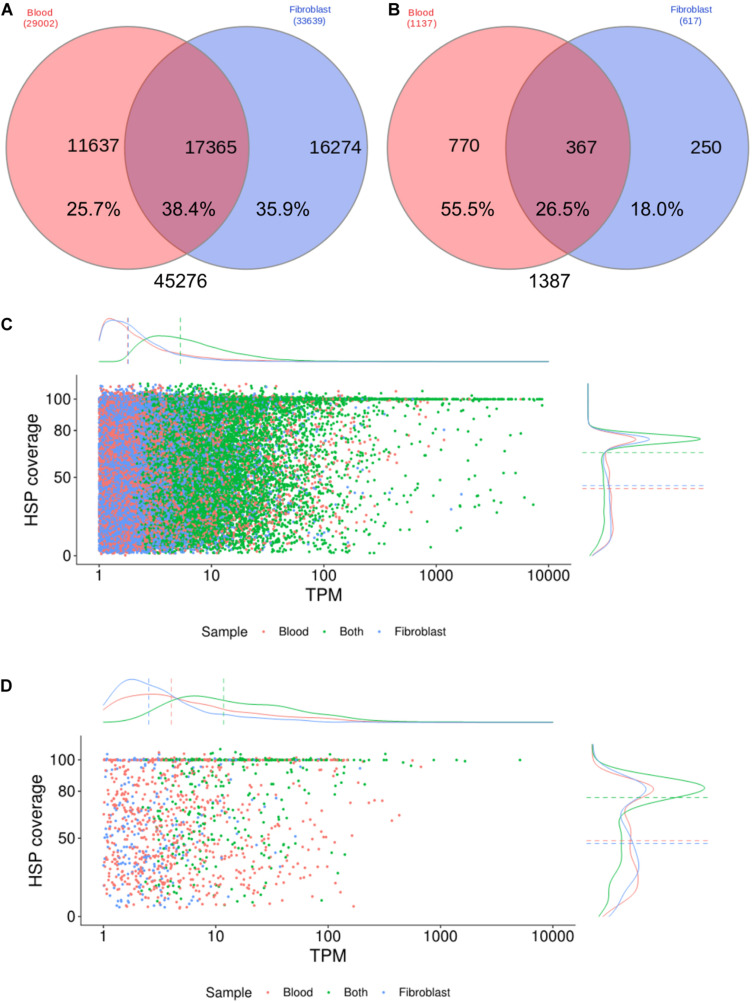
FIGURE 1.
Expression profiles of the Brachyteles arachnoides transcriptome from blood cells and fibroblasts. (A) Venn diagram comparing all CDS with BLAST hit expressed (TPM ≥ 1) by blood cells and fibroblasts. (B) Venn diagram comparing the number of CDS homologous to proteins of the innate immune system. (C) HSP coverage plotted against TPM values with marginal density plots considering all CDS. (D) HSP coverage plotted against TPM values with marginal density plots considering CDS homologous to proteins of the innate immune system.

