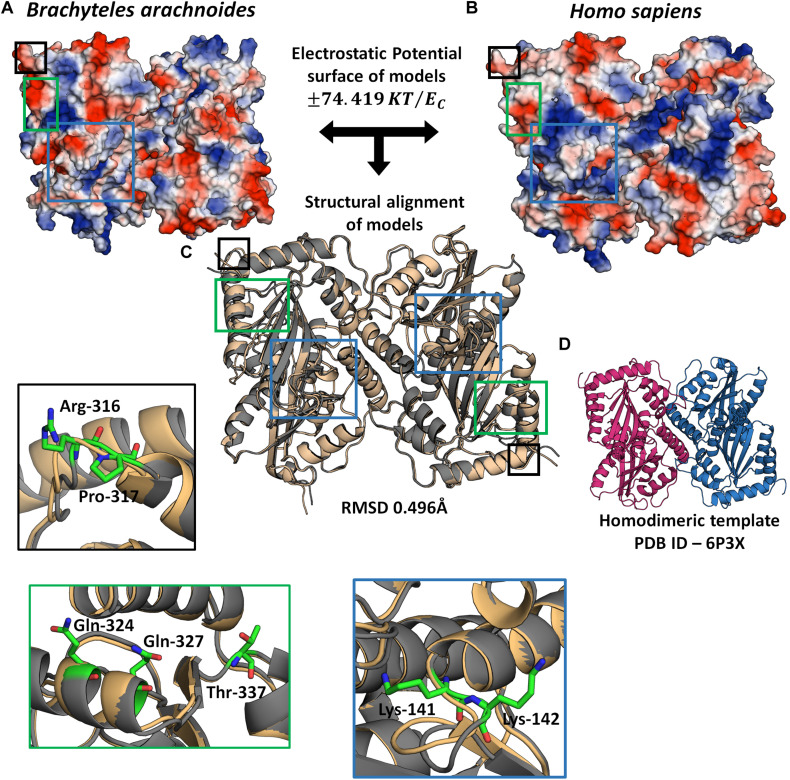
FIGURE 5.
3D Model of APOBEC3G homodimer. Electrostatic profile of B. arachnoides (A) and H. sapiens (B) APOBEC3G: the bluest zones on protein surface represent values +74.419 KT/ec; the reddest zones represent values −74.419 KT/ec of the electrostatic properties; white regions mean zero values of the electrostatic potential. (C) The structural alignment between APOBEC3G Homo sapiens models (gold cartoon) and B. arachnoides (gray cartoon). (D) Template used for structural modeling, showing the homodimeric interaction between two APOBEC3Gs. Insets show residues (in sticks) under positive selection in muriqui sequence, border color of insets corresponds to each specific highlighted region in C.

