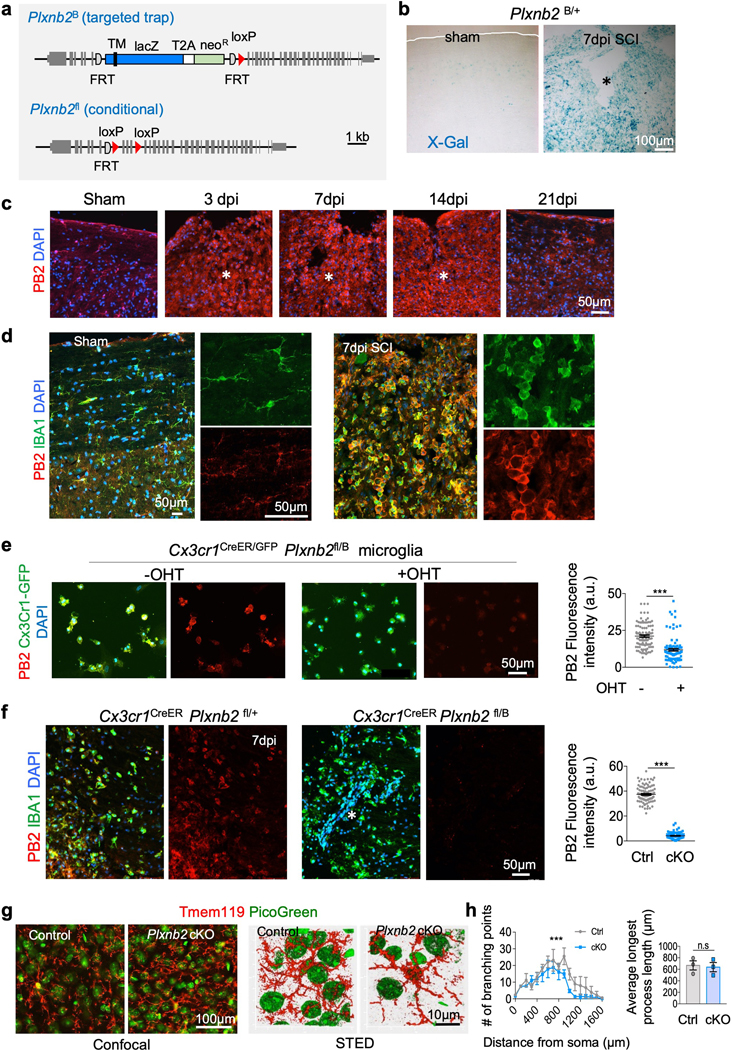
Fig. 2. Upregulation of Plexin-B2 in myeloid cells after SCI.

a. Schematics of Plxnb2 mutant alleles. Top, targeted trap null allele (Plxnb2B) that carries an insertion of a lacZ reporter cassette. TM, transmembrane domain. Neo, neomycin resistance gene. Bottom, Plxnb2 conditional allele (Plxnb2fl) that carries loxP sites flanking coding exons 7–9. Grey boxes depict exons. Semi-circles depict FLP recombinase target (FRT) sequences. Red triangles depict loxP sites.
b. X-Gal staining of sagittal sections of thoracic spinal cords from Plxnb2B/+ mice show increased expression of lacZ reporter at 7 days after SCI as compared to sham control. Images from 3 independent mice for each condition showed similar results.
c. IHC shows robust upregulation of Plexin-B2 (PB2) at the lesion site after SCI at 3, 7 and 14 dpi, which started to waned at 21 dpi. DAPI for nuclear counterstaining. n=4 independent mice per timepoint, with similar results obtained.
d. Images of co-immunostaining show co-localization of Plexin-B2 and IBA1 in the spinal cord tissues at baseline and at 7 days after SCI. Note the robust upregulation of Plexin-B2 in IBA1+ cells after SCI. Higher magnification images shown on the right highlight the morphological changes of IBA1+ cells from ramified at baseline to amoeboid after SCI. n=4 independent mice per timepoint with similar results obtained.
e. ICC of primary microglia isolated from Plxnb2fl/B Cx3cr1CreER/GFP mice show Plexin-B2 ablation with hydroxytamoxifen (OHT). Cx3cr1GFP reporter confirmed purity of the primary microglial culture. Right, scatter dot plots of fluorescence intensity for Plexin-B2, n=100 cells for each condition quantified from 10 independent culture wells, unpaired two-tailed Student’s t test, *** p<0.0001. Data represent mean ± SEM.
f. IHC of injured spinal cord tissues at 7 dpi show Plexin-B2 ablation in IBA1+ cells in Plxnb2fl/B Cx3cr1CreER mice as compared to the high expression levels in littermate control (Plxnb2fl/+ Cx3cr1CreER). Animals were treated with tamoxifen from 3 day before until 7 day after SCI. Right, scatter dot plots of fluorescence intensity for Plexin-B2, n=100 cells for each condition quantified from 3 independent mice, unpaired two-tailed Student’s t test, ***p<0.0001. Data represent mean ± SEM.
g. Left, confocal images of cortical tissue of adult mice stained for microglia marker Tmem119. Animals received tamoxifen injection for 14 days (every other day, total 7 injections). PicoGreen for nuclear counterstaining. Right, maximum intensity projection of STED microscopic images show microglia cellular processes. Images obtained from 3 pairs of mice showed similar results.
h. Quantifications show reduced branching points in Plxnb2 cKO microglia as compared to control. Sholl analysis was performed at 100 μm radius intervals (n=17 cells per genotype, from 3 independent pairs of mice). Two-way ANOVA with Bonferroni’s post hoc correction for repeated measures, ***p<0.001). F(DFn, DFd): F(1,640)=83.1 for column factor, F(159,640)=7 for row factor. Microglia from Plxnb2 cKO and control mice displayed comparable average length of the longest process (data were averaged for each animal, n=3 mice for each genotype), Unpaired two-tailed Student’s t test, n.s., p=0.81. Data represent mean ± SEM.
Asterisks in b, c, f denote the lesion core.
