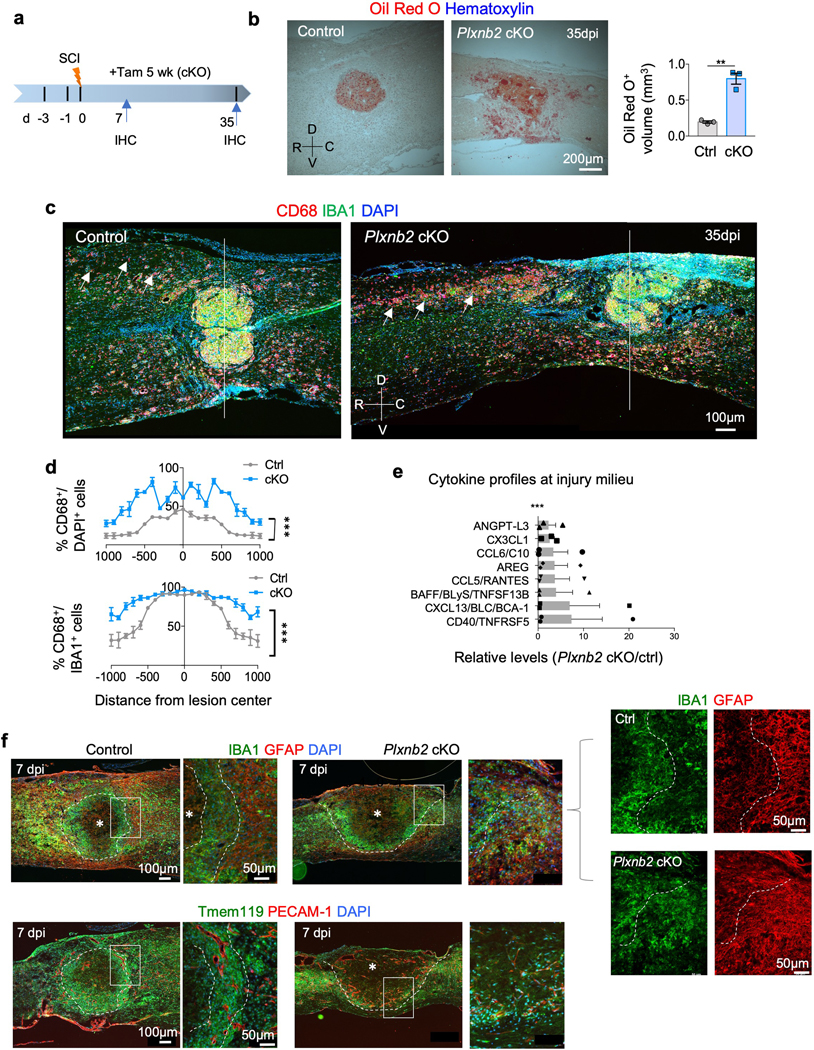
Fig. 5. Impaired containment of phagocytic cells and altered cytokine milieu in Plxnb2 cKO after SCI.

a. Experimental scheme. Tamoxifen was injected every other day from 3 days before until 5 weeks after SCI. IHC was performed at 7 and 35 dpi.
b. Sagittal sections of thoracic spinal cords at 35 dpi reveal widespread Oil Red O lipid staining in Plxnb2 cKO mice as compared to littermate controls, in which lipid debris was contained at the lesion core. Quantifications show calculated Oil Red O+ volume at the injury site, n=3 mice per group, unpaired two-tailed Student’s t-test, **p=0.0015. Data represent mean ± SEM. R-rostral; C-caudal; D-dorsal; V-ventral.
c. Representative IHC images of sagittal sections of thoracic spinal cords show diffuse spread of CD68+ cells and prolonged phagocytosis phenotype of IAM (IBA1+) in Plxnb2 cKO mice even at 5 weeks after SCI (white arrows). Also note impaired corralling of the immune cells and compromised wound compaction in Plxnb2 cKO mice. White line demarcates the lesion center. Images from 3 independent mice for each condition showed similar results.
d. Quantifications show the extent of the spread of phagocytotic cells measured by the prevalence of CD68+ cells among DAPI+ or IBA+ cells at the indicated locations from the lesion center. n=3 mice per group, two-way ANOVA with Bonferroni post hoc correction, ***p<0.0001. For CD68+/DAPI, F(DFn, DFd): F(1, 84)=645.3 for column factor, F(20, 84)=25.83 for row factor. For CD68+/IBA1+, F(DFn, DFd): F(1, 84)=203.4 for column factor, F(20, 84)=32.62 for row factor. Data represent mean ± SEM.
e. Proteome profiler assays show relative levels of upregulated (>2-fold) cytokines or secreted factors at the injury site in Plxnb2 cKO compared to control littermates at 14 dpi after T8 contusion injury. n=3 mice per group, two-way ANOVA with Bonferroni post hoc correction, ***p<0.0001 for the entire profile of 64 proteins on the array. Only proteins with relative levels above the cutoff of 2.0 are plotted. Data represent mean ± SEM.
f. IHC images of consecutive sagittal sections of thoracic spinal cords at 7 dpi (top and bottom panels) stained for the indicated markers reveal early stage corralling phenotype in Plxnb2 cKO animals. Higher magnification images are shown on the right. Top panels show necrotic core (white asterisk) corralled by an inner rim of IBA+ immune cells and an outer rim of GFAP+ astrocytes. White dashed lines delineate the border of spatial segregation between the two populations. Bottom panels show Tmem119+ microglia forming a concentric rim confining the necrotic core in control animals; blood vessels (PECAM-1+) with large lumen size displayed the same concentric orientation. In contrast, in Plxnb2 cKO animals, IBA1+ or Tmem119+ immune cells and GFAP+ astrocytes failed to form concentric rims, resulting in unsealed wound at the dorsal surface and diffuse neo-vasculature with random orientation. Images from 3 independent mice for each group showed similar results.
