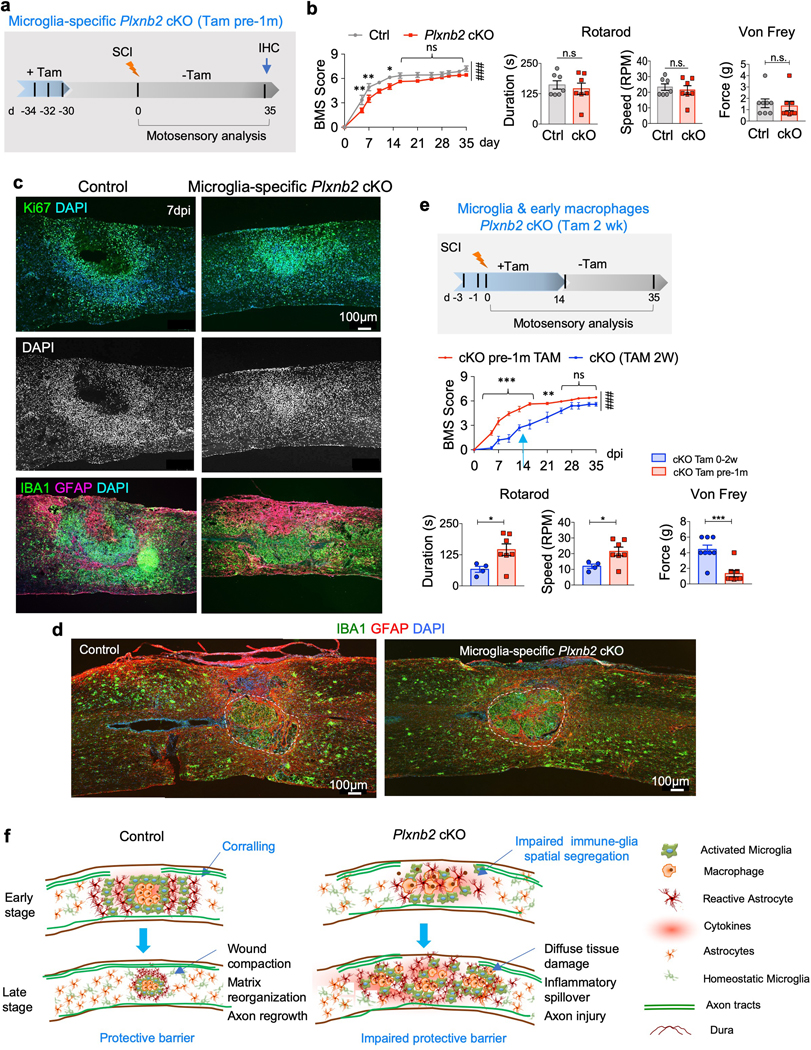
Fig. 8. Plexin-B2 activity in both microglia and macrophages contributes to functional recovery after SCI.

a. Experimental scheme for microglia-specific Plxnb2 cKO with only three tamoxifen injections delivered one month before SCI (Tam pre-1m).
b. BMS scores show worse motor recovery during the first two weeks after injury in Plxnb2 cKO cohort, but a subsequent catch up thereafter, n=8 per group, two-way ANOVA with Bonferroni post hoc correction, **p=0.008, **p=0.0022, and *p=0.031, respectively; ###p<0.0001 for the entire recovery course. F(DFn, DFd): F(1, 156)=47.85 for column factor, F(11, 156)=116.1 for row factor. Rotarod and von Frey tests show no significant differences between the two cohorts at 35 dpi. For Rotarod test, n=7 for each genotype, unpaired two-tailed Student’s t-test, n.s., p=0.59 for duration, n.s., p=0.59 for speed. For von Frey filament tests, n=4 mice per group, left and right hindpaws measured separately, Mann Whitney test, n.s., p=0.081. Data represent mean ± SEM.
c. IHC of sagittal sections of thoracic spinal cords at 7 dpi show sign of early corralling with Ki67+ cells forming a rim corralling cell-poor, necrotic core in control mice, whereas in microglia-specific Plxnb2 cKO mice, Ki67+ cells displayed less dispersion and congregated at the lesion core. DAPI nuclear counterstain highlights spatial pattern of cell density at the injury site. Images from 3 independent mice per group showed similar results.
d. IHC of thoracic spinal cords of both control or microglia-specific Plxnb2 cKO mice display successful corralling and wound compaction at 35 dpi. Images from 3 independent mice per group showed similar results.
e. Comparison of BMS scores during 5 week recovery, and rotarod and von Frey tests at 35 dpi show better motosensory recovery for the cohort with microglia-specific Plxnb2 cKO cohort (Tam pre-1m, n=7, the same cohort as in Fig. 8b) as compared to the Tam 2 wk cohort (n=4, the same cohort as in Fig. 6d). Two-way ANOVA with Bonferroni post hoc correction, ***p=0.0002 for 5 dpi and p<0.0001 for subsequent three timepoints, **p=0.0010, ###p<0.0001 for the entire recovery course. F(DFn, DFd): F(1, 132)=158 for column factor, F(11, 132)=95.4 for row factor. For Rotarod test, n=7 for the Tam pre-1m cohort, n=4 for the Tam 2 wk cohort, unpaired two-tailed Student’s t-test, *p=0.038 for duration, *p=0.038 for speed. For von Frey filament tests, n=4 mice per group, left and right hindpaws measured separately, Mann Whitney test, ***p=0.00050. Data represent mean ± SEM.
f. Diagrams illustrate the importance of Plexin-B2 induction in IAM in mediating early corralling, thereby facilitating debris clearing, inflammation containment, and subsequent matrix reorganization and wound compaction.
