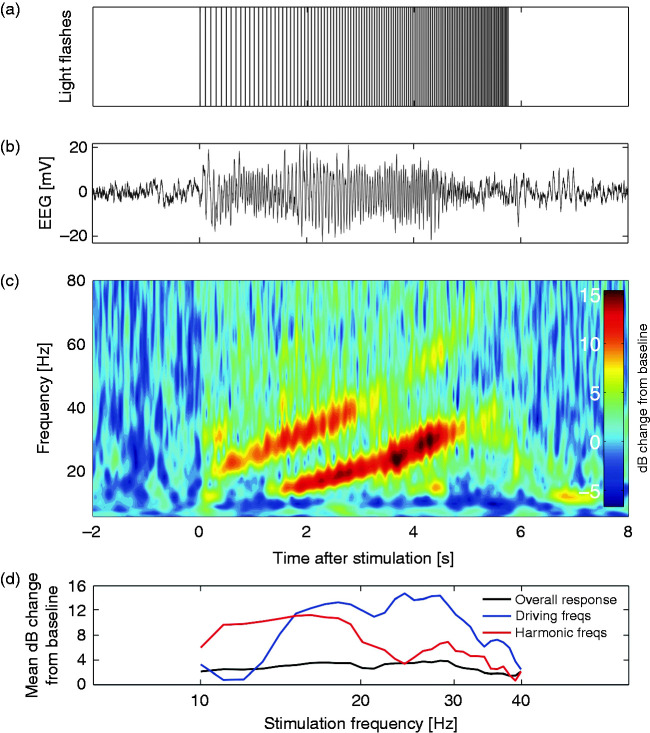
Figure 1.
(a) The chirp stimulus consisting of four light flashes per frequency between 10 and 40 Hz, resulting in a total duration of ∼6 seconds. (b) Example trace of an averaged EEG response (average of 10 responses) at electrode Oz of a control subject. (c) Time-frequency representation of the averaged response with baseline correction, displayed as decibel (dB) change from baseline. Distinct responses at the driving frequency (between 10 and 40 Hz) and at the harmonic frequencies (between 20 and 80 Hz) are present. (d) Example trace of the mean dB change in overall power (response at 5–125 Hz; black line), driving frequencies (response at stimulation frequency; blue line) and harmonic frequencies (responses at twice the stimulation frequency; red line) from baseline per stimulation frequency. Responses are analyzed with respect to EEG power per frequency for the duration of the four flashes plus 100 milliseconds afterwards, for the overall response, driving and harmonic frequencies.

