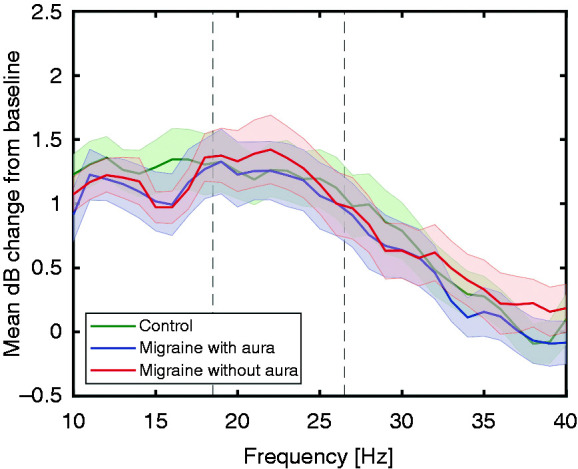
Figure 3.

Overall response power (between 5 and 125 Hz), assessed per stimulation frequency as mean (± standard error) decibel (dB) change from baseline, for the different chirp stimulation frequencies. No differences in EEG power at electrode Oz (7-channel EEG) are present between controls and migraine with and without aura subjects, measured interictally, in the three pre-defined bands of interest (10–18 Hz, 19–26 Hz and 27–40 Hz; borders indicated by dashed lines).
