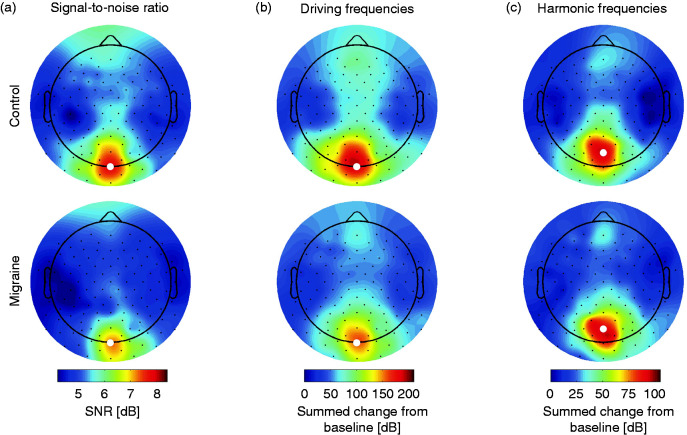
Figure 5.
Topographical distribution of signal-to-noise ratio (SNR) of 126-channel EEG responses between 5 and 45 Hz (a) and summed responses at driving (b) and harmonic frequencies (c) as change from baseline in decibel (dB). Highlighted channel (white dot) indicates the channel with maximum response per group and parameter (Oz for SNR and driving frequencies, POz for harmonic frequencies).

