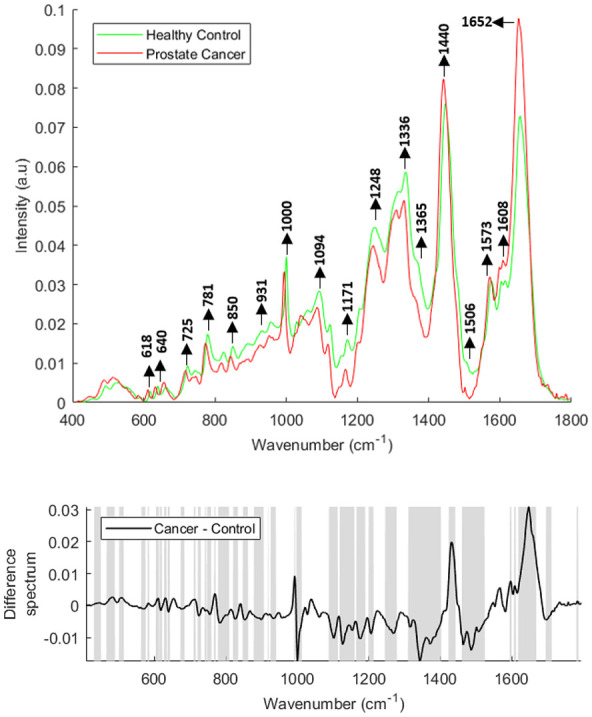
Figure 3.

Mean Raman spectra of lymphocytes from healthy donors and prostate cancer patients (top panel). Raman difference spectrum of lymphocytes from healthy controls and prostate cancer patients (bottom panel). The shaded regions depict the spectral regions which are significantly different between each sample set using a two-tailed t-test with p < 0.001.
