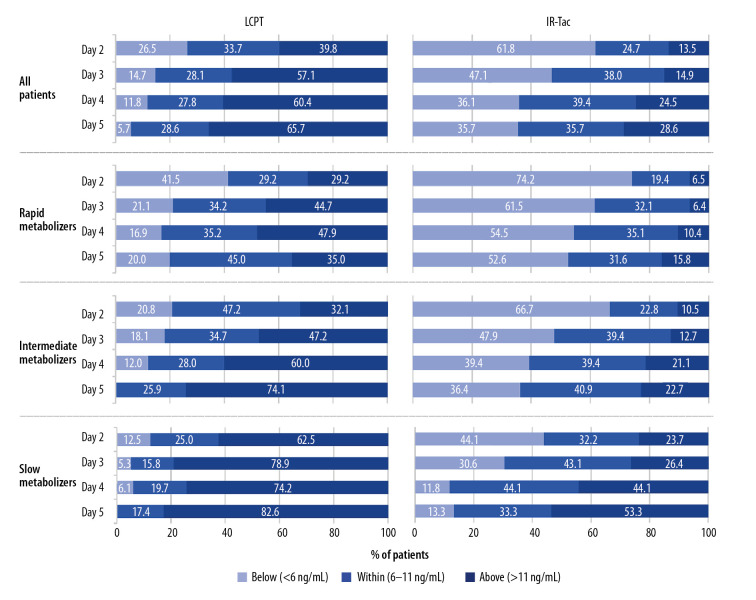
Figure 2.
Attainment of trough concentrations on days 2–5. The analysis population consisted of patients who had a calculable day 30 C/D ratio based on central or local laboratory data. Shown are the proportions of patients above, within, or below the target range. C/D – concentration/dose; IR-Tac – immediate-release tacrolimus; LCPT – LCP-tacrolimus.

