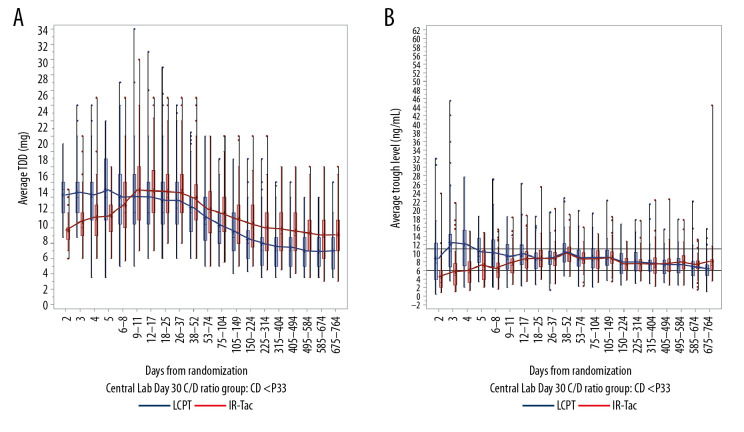
Figure 3.
Total daily dose (A) and trough concentrations (B) of tacrolimus in rapid metabolizers. The analysis population consisted of patients who had a calculable day 30 C/D ratio based on central laboratory data only. Central boxes indicate the 25th to 75th percentile, and central lines the median (50th percentile). Whiskers indicate full concentration ranges. Lines connect the mean trough concentrations. C/D – concentration/dose; IR-Tac – immediate-release tacrolimus; LCPT – LCP-tacrolimus.

