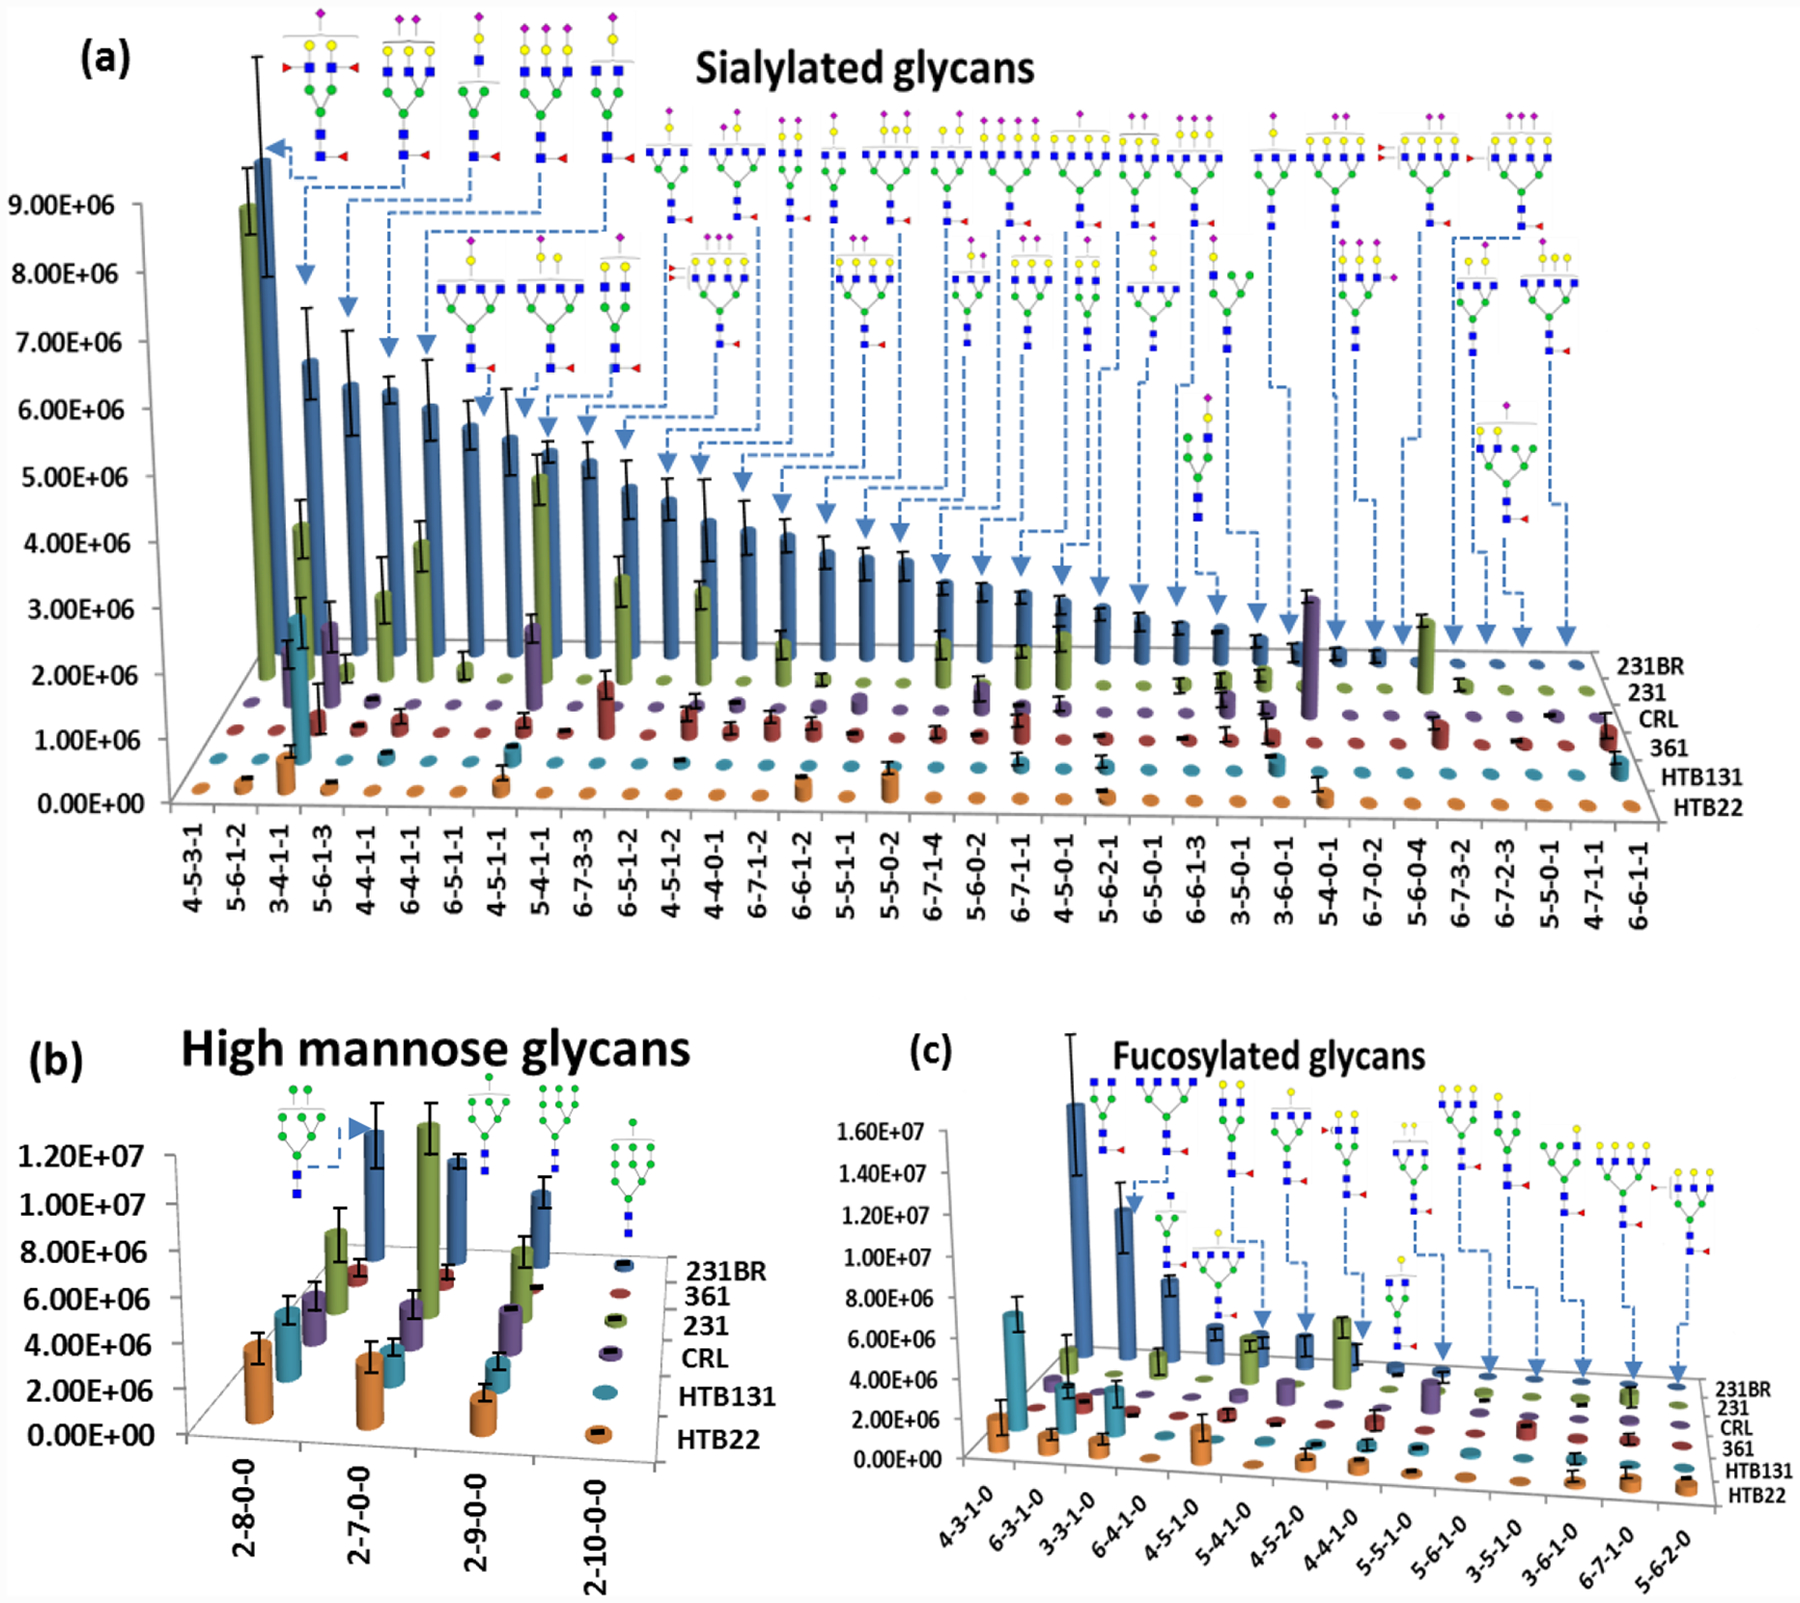
Figure 4.

Quantitation bar graphs of glycan structures that are significantly different (P <0.05) in cancer cell lines (231BR, 231, 361, HTB131, and HTB22 and CRL). (Two sample preparation replicates were performed; Error bars stand for standard deviation.) Symbols as in Table 1. Naming of glycan compositions as in Figure 3.
