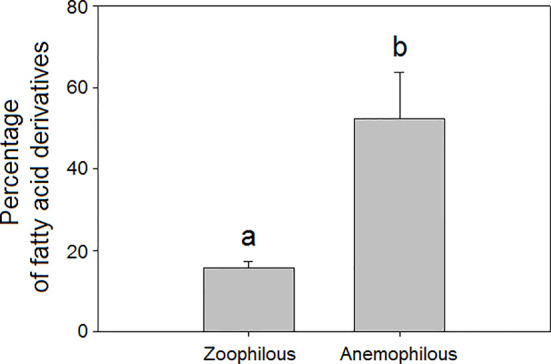
Figure 3.

Relative percentage composition of VOCs in the floral scents of zoophilous (N = 9) and anemophilous plant species (N = 254): percentages of fatty acid derivatives. Error bars indicate standard errors of the means. Different letters indicate significant differences between groups (Kruskal-Wallis test, α = 0.0063).
