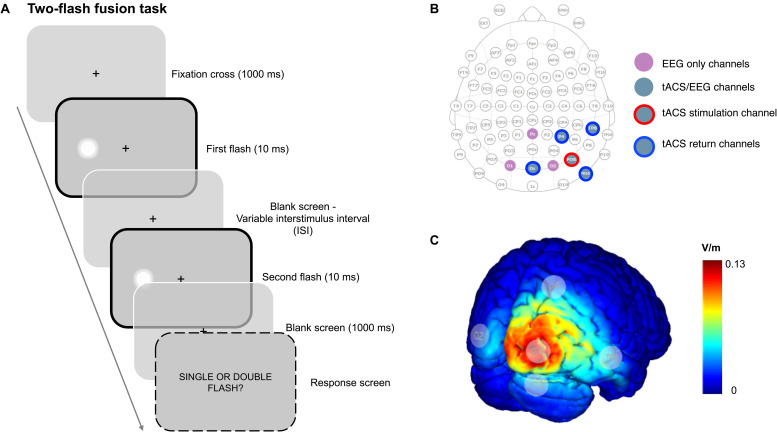
FIGURE 1.
(A) Illustration of a trial example and of the two-flash fusion task employed in the present study. (B) tACS/EEG montage. (C) tACS voltage distribution on the cortical surface; as it can be seen, the maximum voltage was delivered on the right extra-striate visual areas including V5/MT, in agreement with previous studies stimulating in PO8 (stimulation electrode was placed in PO8) (Zito et al., 2015).

