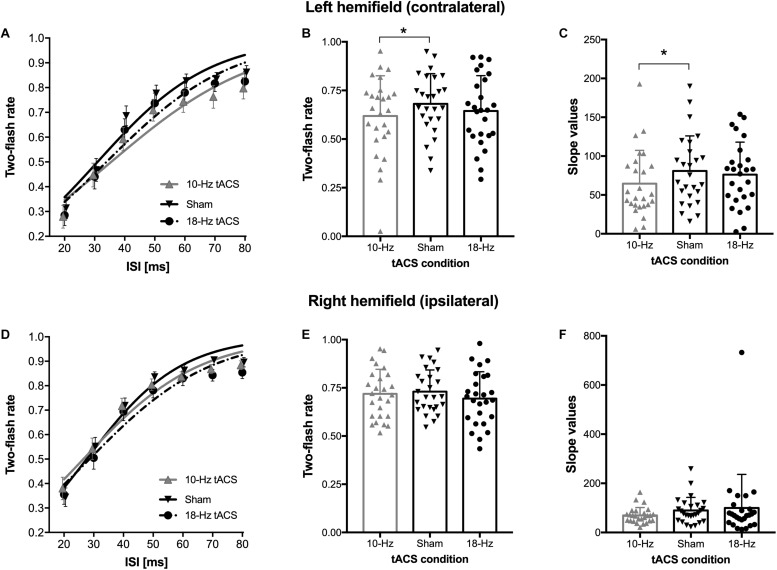
FIGURE 2.
Effect of tACS on temporal integration/segregation performance. Average two-flash response rate as a function of inter-stimulus interval (ISI) and relative psychometric functions for the (A) left/contralateral and the (D) right/ipsilateral hemifield trials obtained while participants received 10-Hz, 18-Hz, or sham tACS. Two-flash response rate (averaged across ISIs) as a function of tACS conditions for the (B) left/contralateral and the (E) right/ipsilateral hemifield trials, with dots representing individual observations and bars showing group average. Slope values of the psychometric curve (logistic) obtained from the individual data as a function of tACS conditions for the (C) left/contralateral and the (F) right/ipsilateral hemifield trials, with dots representing individual observations and bars showing group average. ∗ Indicates p-values < 0.05. Error bars represent the SEM.

