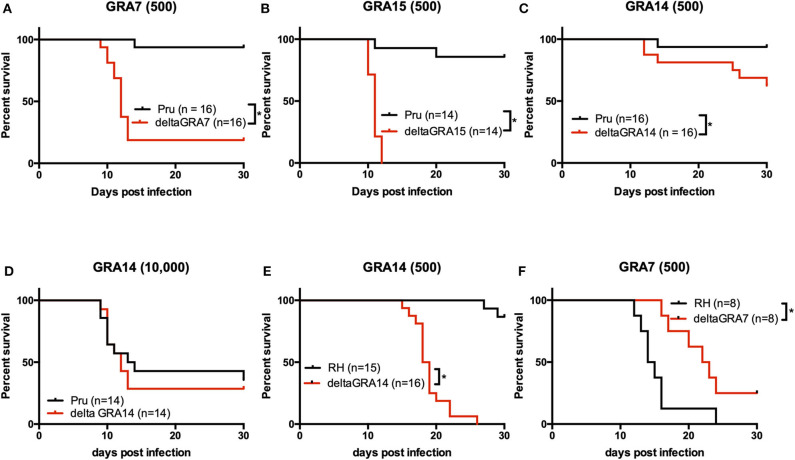
Figure 7.
Survival in mice infected with T. gondii. (A–E) Mice were intraperitoneally infected with a low dose (500) or a high dose (104) of T. gondii tachyzoites of parasites strains, and survival was monitored for 30 days. (A) Survival rate of mice infected with 500 tachyzoites. In total, 16 mice were infected per strain (6 + 10). Data are summarized from two independent experiments. (B) Survival rate of mice infected with 500 tachyzoites. In total, 14 mice were infected per strain (6 + 8). Data are summarized from two independent experiments. (C) Survival rate of mice infected with 500 tachyzoites. In total, 16 mice were infected per strain (6 + 10). Data are summarized from two independent experiments. (D) Survival rate of mice infected with 104 tachyzoites. In total, 14 mice were infected per strain (6 + 8). Data are summarized from two independent experiments. Statistical analysis was performed using a log rank test (p < 0.05). (E) Mice were infected via the intra-footpad route with 500 T. gondii tachyzoites of the RHΔgra14 mutant and its parental strain, and survival was monitored for 30 days. In total, 15 and 16 mice were infected per strain (RH, 7 + 8; RHΔgra14, 8 + 8). (F) Mice were infected via the intra-footpad route with 500 T. gondii tachyzoites of the RHΔgra7 mutant and its parental strain, and survival was monitored for 30 days. In total, 8 and 8 mice were infected per strain (RH, 8; RHΔgra7, 8). This experiment was performed once. Statistical analysis was performed using the log rank test (p < 0.05). *indicates a significant difference.

