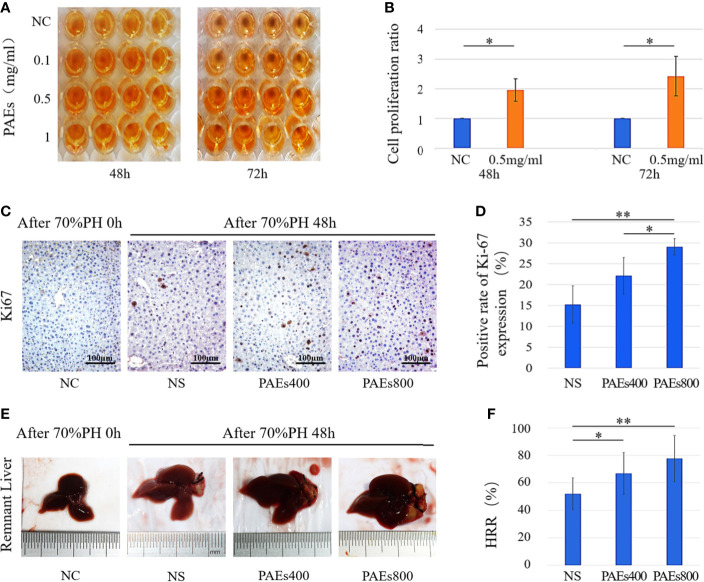
Figure 1.
PAEs efficacy in hepatocyte proliferation both in vitro and in vivo relative to control. (A) Representative images of CCK-8 color reactions in 96-well plates at 48 and 72 h after treatment with different PAEs concentrations. (B) Differences in L02 cell proliferation ratios between PAEs treatment group (0.5 mg/ml) and NC group were significant at 48 and 72 h according to Student’s t-test (*P < 0.05). (C) Ki-67 expression levels in residual liver cell nuclei and cytoplasm at 48 h after 70% PH. (E) Representative images of residual liver at 48 h after 70% PH. Each group included nine mice. (D, F) Differences between PAEs and NS groups were significant according to Student’s t-test (*P < 0.05; **P < 0.01).

