Figure 3.
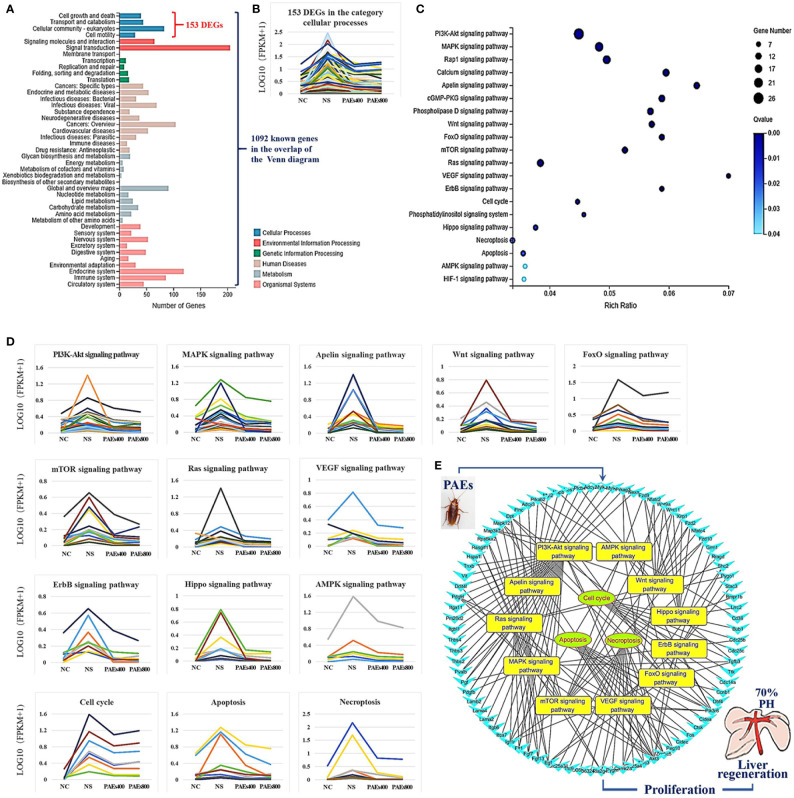
KEGG analysis of DEGs. (A) Annotation and classification by KEGG analysis. (B) Expression of 153 DEGs in the “Cellular Processes” category. (C) Top 20 pathways. Enrichment of 153 DEGs by KEGG pathway enrichment analysis against all identified elements. Level 2 restricted to “Cell Growth and Death” and “Signal Transduction”. Among them, 26 DEGs enriched in PI3K-AKT signaling pathway, and 21 in MAPK signaling pathway. Only seven DEGs enriched in VEGF signaling pathway, but rich ratio was the highest. This analysis result indicated an extremely complex molecular mechanism in the process by which PEAs can promote liver regeneration. (D) DEG expression levels in pathways. Legend shown in Table 1. (E) PAEs accelerate hepatocyte proliferation and promote liver regeneration via complex networks. DEG-pathway network constructed by linking 153 DEGs (blue triangles), associated signaling pathways (yellow round rectangles), and cellular processes (green ellipses).

