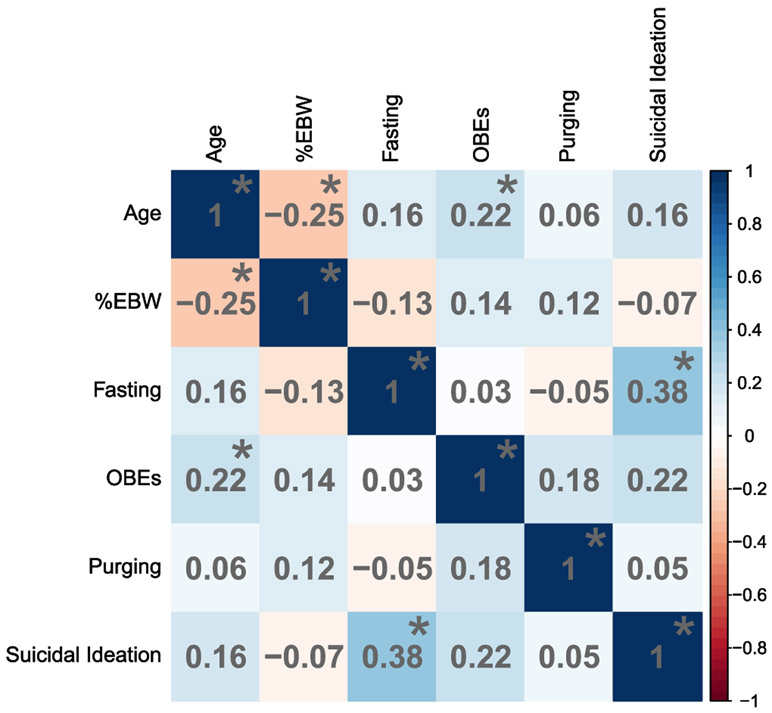
FIGURE 1.
Correlation matrix among demographics and clinical characteristics. %EBW, percent expected body weight; OBEs, objective binge episodes. Darker blue colors indicate stronger, more positive correlations and darker red colors indicate stronger, more negative correlations. Significant correlations are indicated by an asterisk

