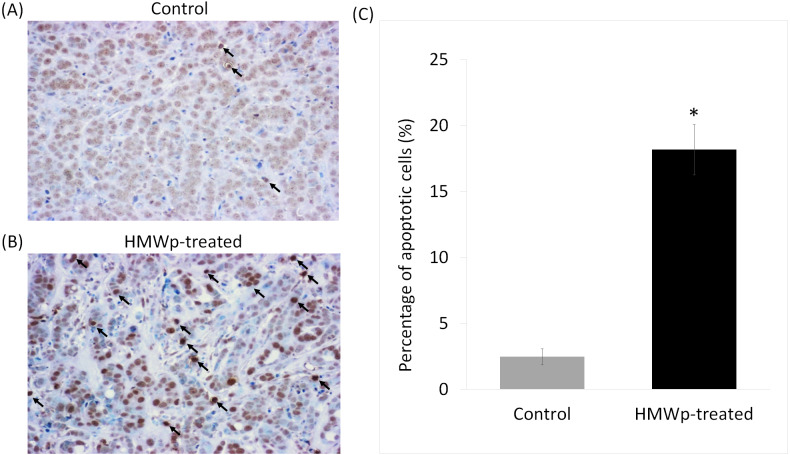
Figure 4. Apoptotic effect of HMWp treatment on MCF7 tumors.
Tumor tissue sections from mice treated with (A) PBS (control) and (B) HMWp were stained with TUNEL (representative images at 100 × magnification). Dark arrows indicate the apoptotic cells (stained in dark brown). (C) Percentage of TUNEL-positive cells detected in tumor sections from PBS control and HMWp-treated mice. Data are expressed as mean ± SD (n = 6). ∗ indicates significant difference in the average percentage of TUNEL-positive cells in control and treatment groups (p < 0.05).

