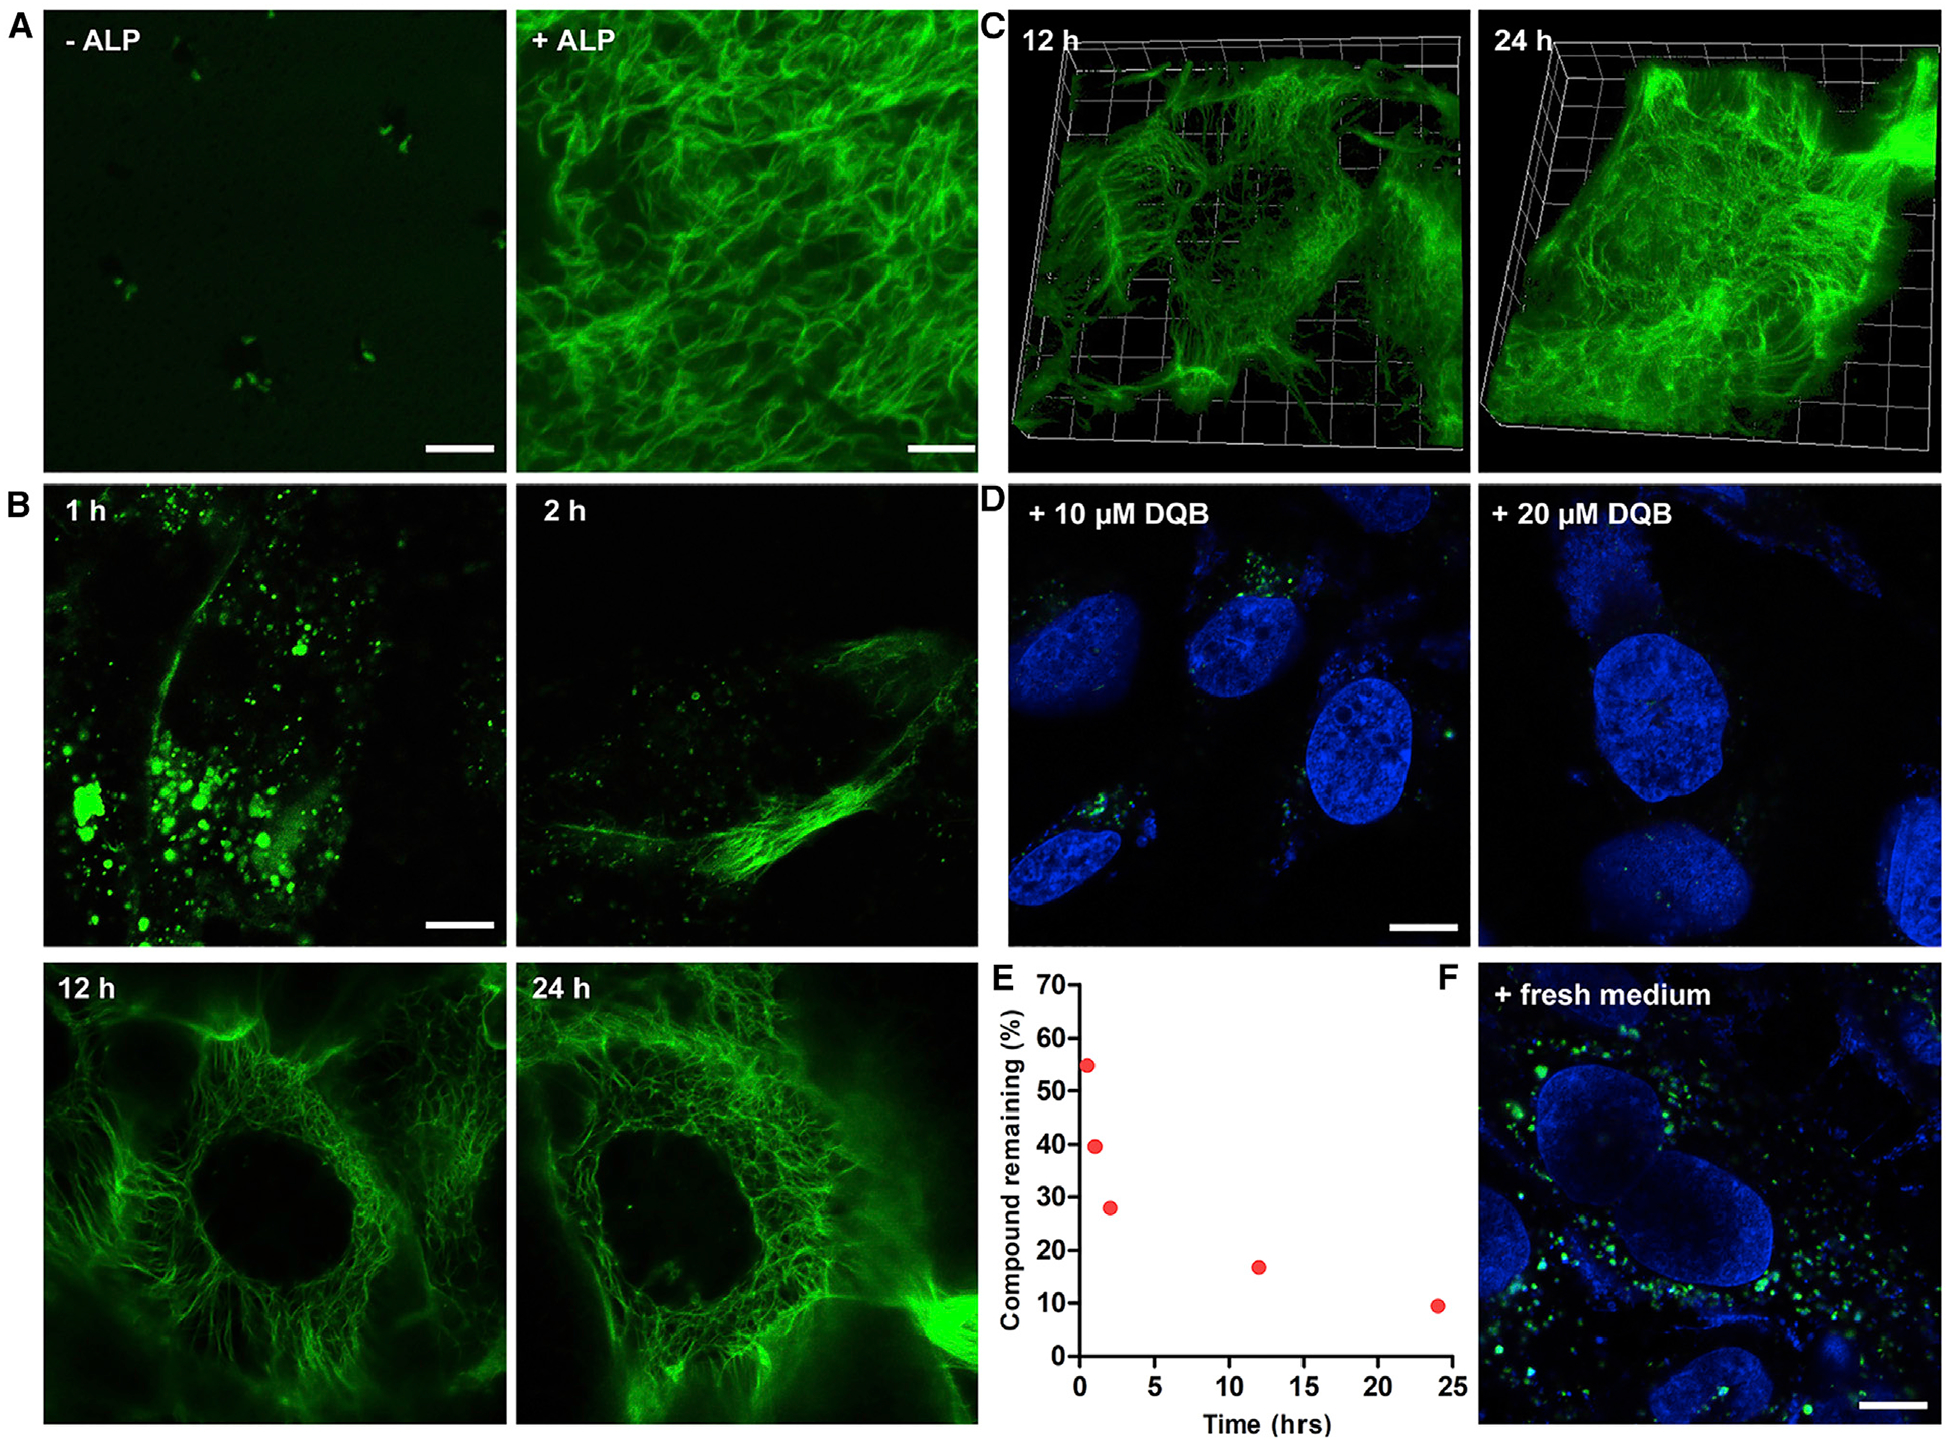
Figure 2. Formation of the Intracellular Filaments.

(A) CLSM images of nanostructures formed before and after adding ALP (2 U/mL) to the solution of 1P-KMe3 (200 μM). Scale bars, 5 μm.
(B) CLSM images of Saos-2 cells treated with 1P-KMe3 (200 μM) at different time. Scale bars, 10 μm.
(C) Three-dimensional CLSM image of Saos-2 cells treated with 1P-KMe3 (200 μM) for 12 or 24 h.
(D) CLSM images of Saos-2 cells treated with 1P-KMe3 (200 μM) and co-incubated with ALP inhibitor (DQB) for 24 h. Scale bars, 10 μm.
(E) Percentage of 1P-KMe3 remaining after treating with Saos-2 cells over the time course of 24 h.
(F) CLSM images of Saos-2 cells treated with 1P-KMe3 (200 μM) for 12 h and then incubated with fresh culture medium for 24 h. Scale bars, 10 μm.
