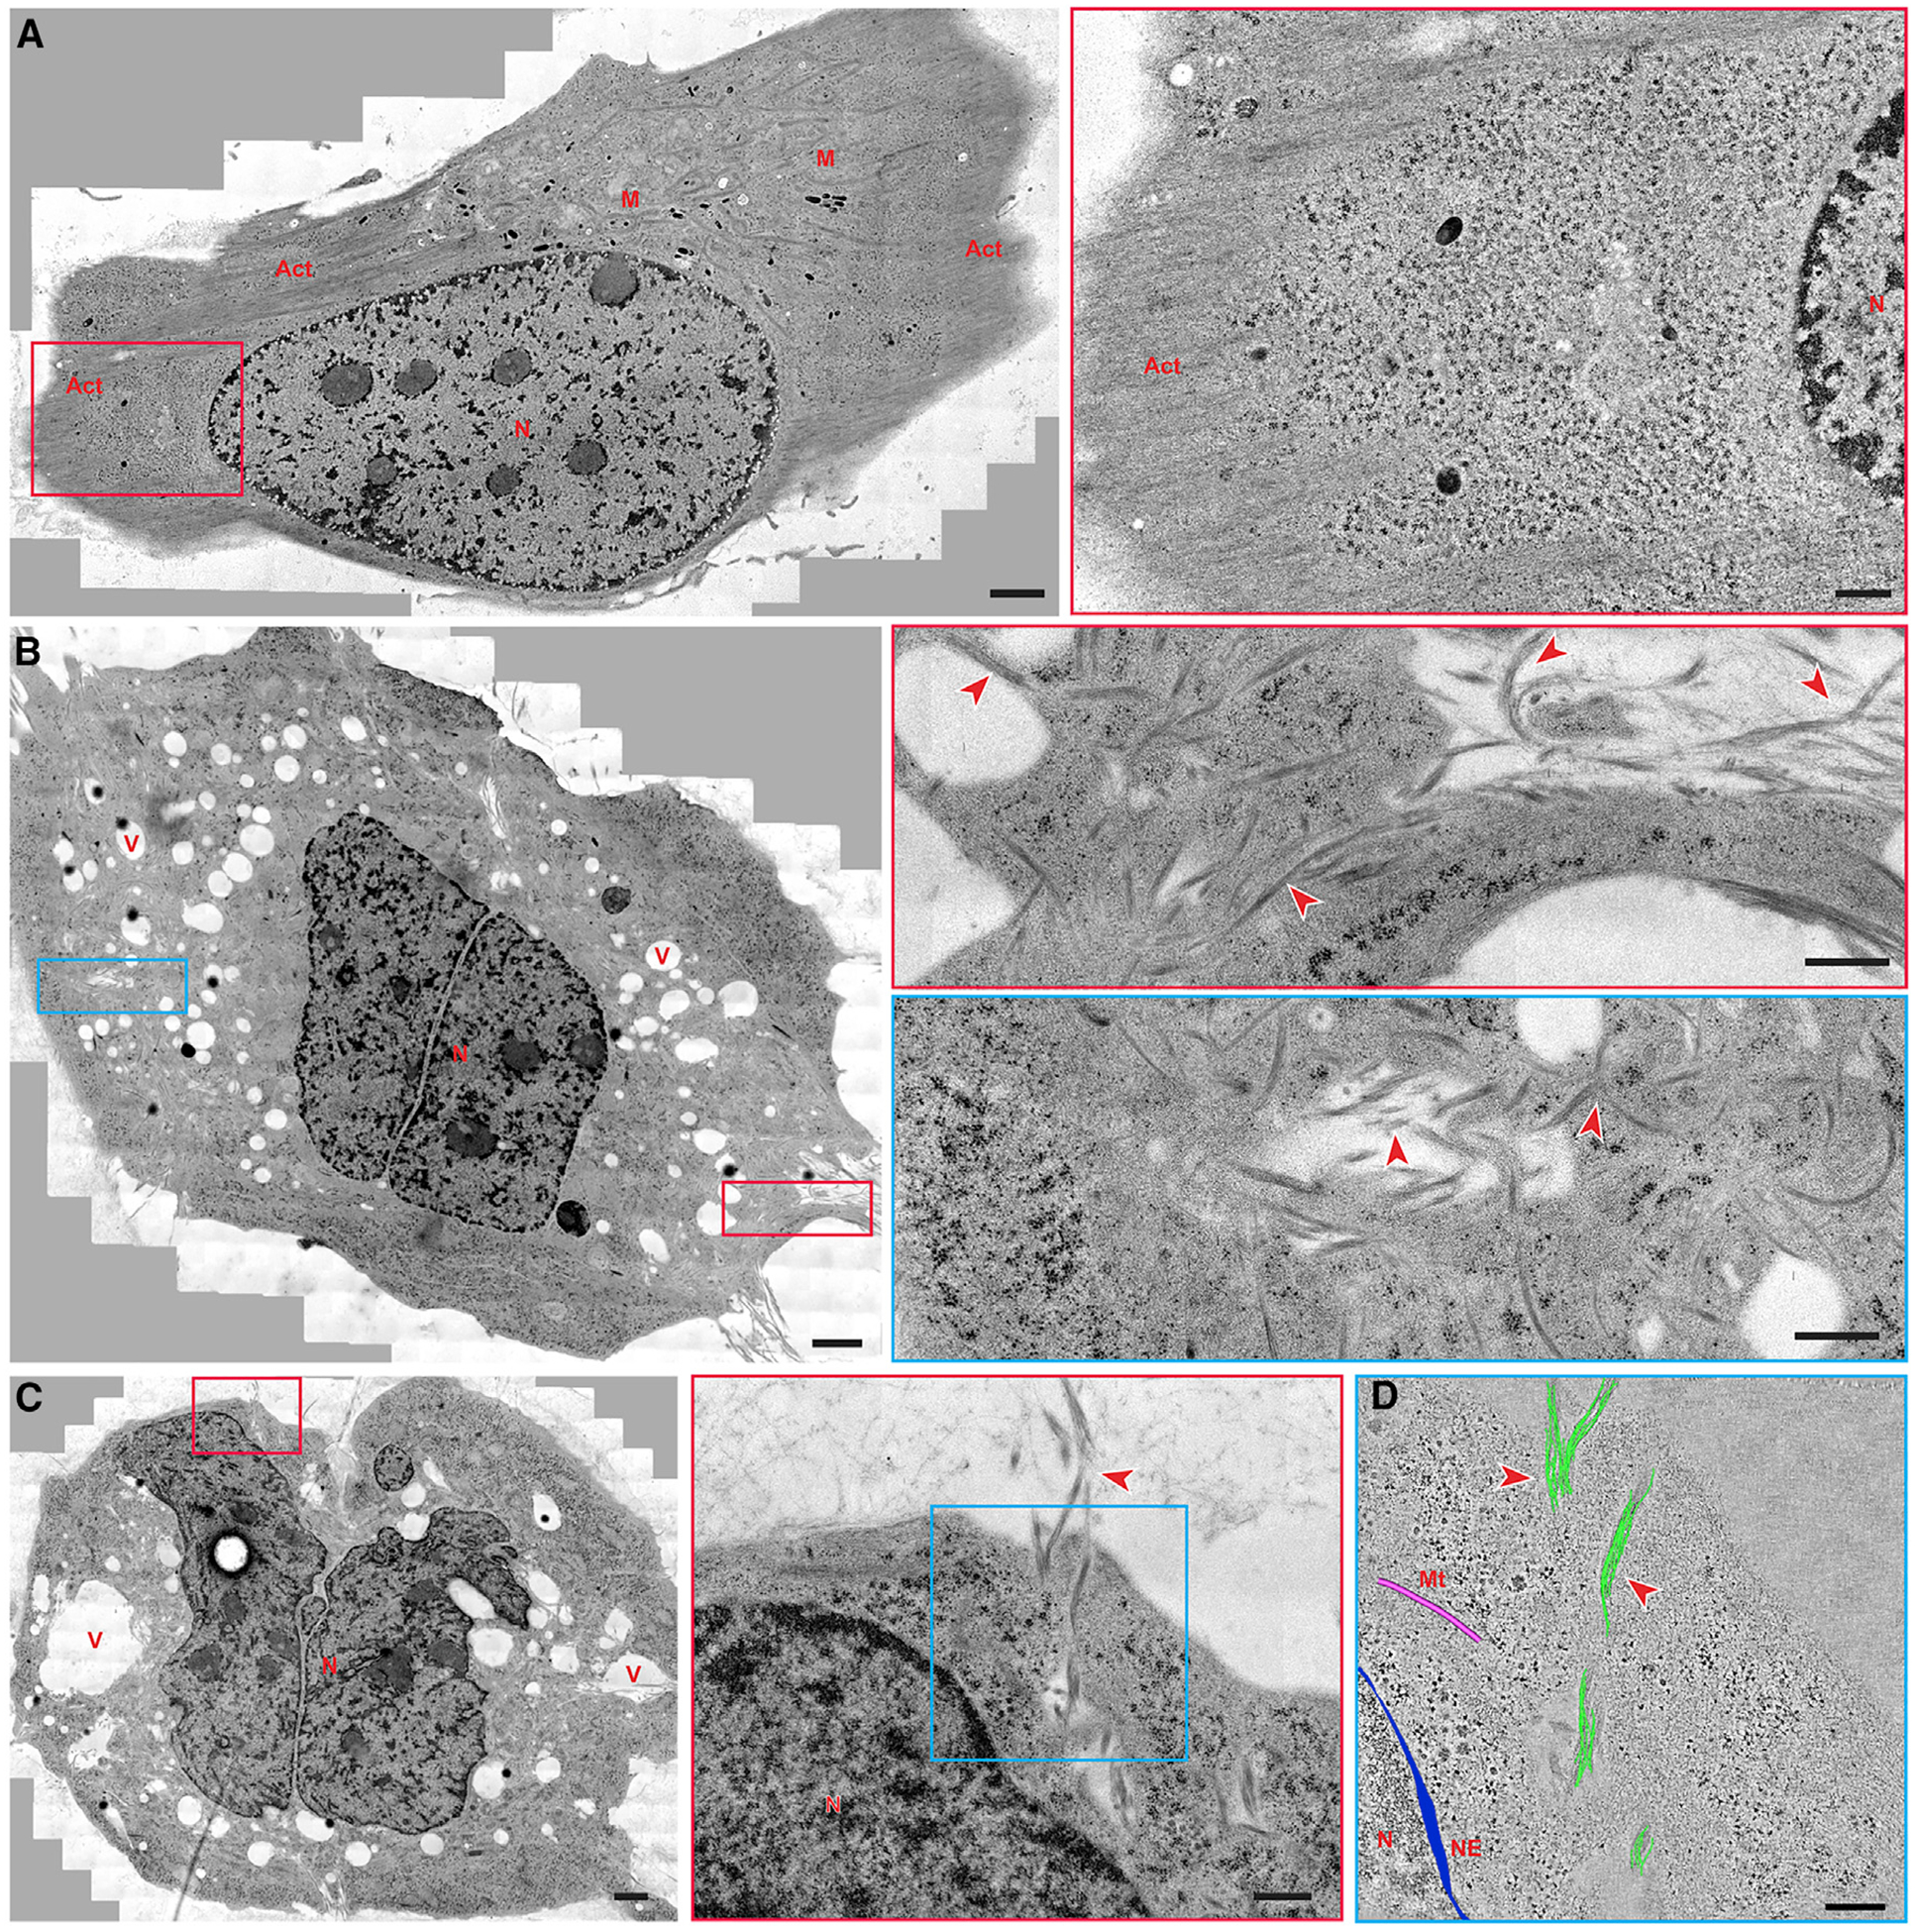
Figure 4. Electron Microscopy Images of the Filament Bundles of the Peptide (1-KMe3) inside the Cells.

(A) TEM image of a whole Saos-2 cell (wild type, untreated) and higher-magnification electron micrograph of the red boxed area.
(B) TEM image of a treated Saos-2 cell (1P-KMe3 200 μM, 24 h) and higher-magnification electron micrographs of the red boxed area and the blue boxed area.
(C) TEM image of another treated Saos-2 cell (1P-KMe3 200 μM, 24 h) and higher-magnification electron micrograph of the red boxed area.
(D) 3D reconstruction models of the filament bundles (green), microtubules (pink), and nuclear envelope (blue) on an electron tomographic image of the blue boxed area in (C).
Solid red arrowheads indicate bundles of artificial filament; N, nucleus; M, mitochondria; Act, actin; V, vacuoles; Mt, microtubules; NE, nuclear envelope. Scale bars in (A)–(C), 2000 nm, in the boxed area in (A)–(C), 500 nm, and in (D), 250 nm.
