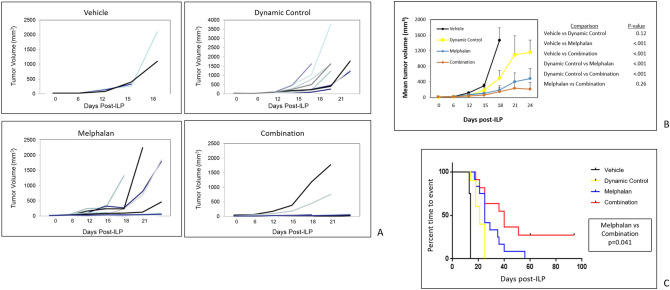
Figure 5.
(A) Individual mouse B16 tumor volume curves among the treatment groups: vehicle (saline), dynamic control alone, melphalan alone, and the combination of dynamic control and melphalan. The combination group had the highest number of mice (10/12) with tumors under 50 cubic mm during the first 3 weeks after ILP, with the exception of two outlier mice. (B) Mean tumor volume curves among treatment groups. Error bars represent standard errors of the mean. The average tumor volume between the combination group and the melphalan alone group was not statistically significant, likely due to the presence of the two outliers in the combination group. (C) Kaplan–Meier curve showing statistically superior outcome for the combination group, even when compared to the melphalan alone group. There were 3 complete responses (25%) in the combination group, and no complete responses in any other group. Data were pooled from 3 replicate experiments.

