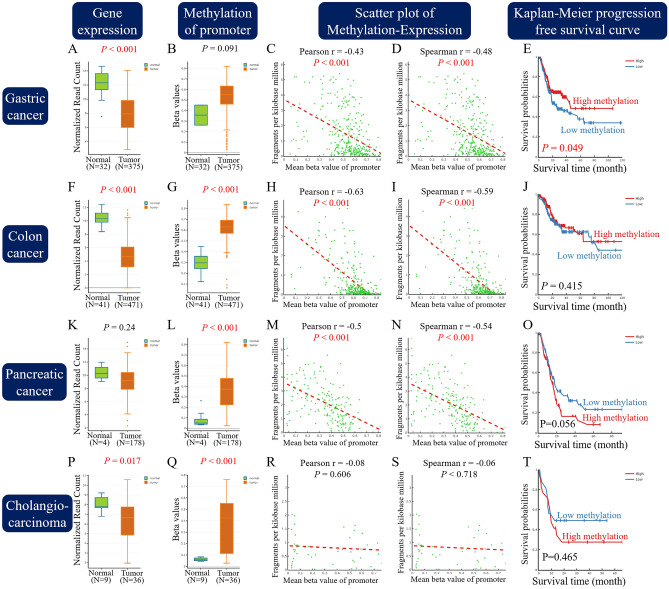
Figure 4.
Analysis of SFRP1 in DNA methylation interactive visualisation database. Five different profiles of information was shown in four kinds of cancer. (A,F,K,P) Gene expression of SFRP1 in RNA-sequencing read count. (B,G,L,Q) Differential methylation of the promoter region of SFRP1. (C,H,M,R) Scatter plots of promoter methylation and gene expression, analysed by Pearson’s method. (D,I,N,S) Spearman’s correlation analysis of promoter methylation and gene expression. (E,J,O,T) Kaplan–Meier progression-free survival curve by the degree of methylation of SFRP1. (A–E), gastric cancer; (F–J), colon cancer. (K–O), pancreatic cancer; (P–T), cholangiocarcinoma. SFRP1, secreted frizzled related protein 1.

