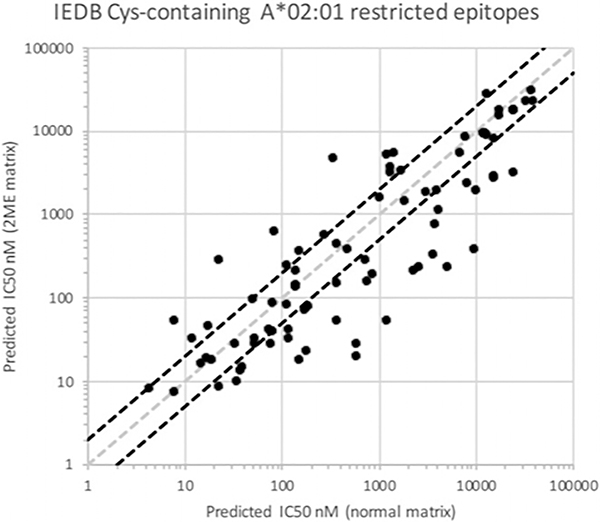
FIGURE 6.
Comparison of predicted binding capacity of known Cys-containing epitopes using matrices derived from PSCL tested under normal conditions, or in the presence of 2-ME. The gray diagonal line demarcates equivalency in the predictions. Points below the diagonal indicate increases in predicted affinity using the 2-ME-derived matrix. Diagonal black lines highlight 2-fold differences in affinity.

