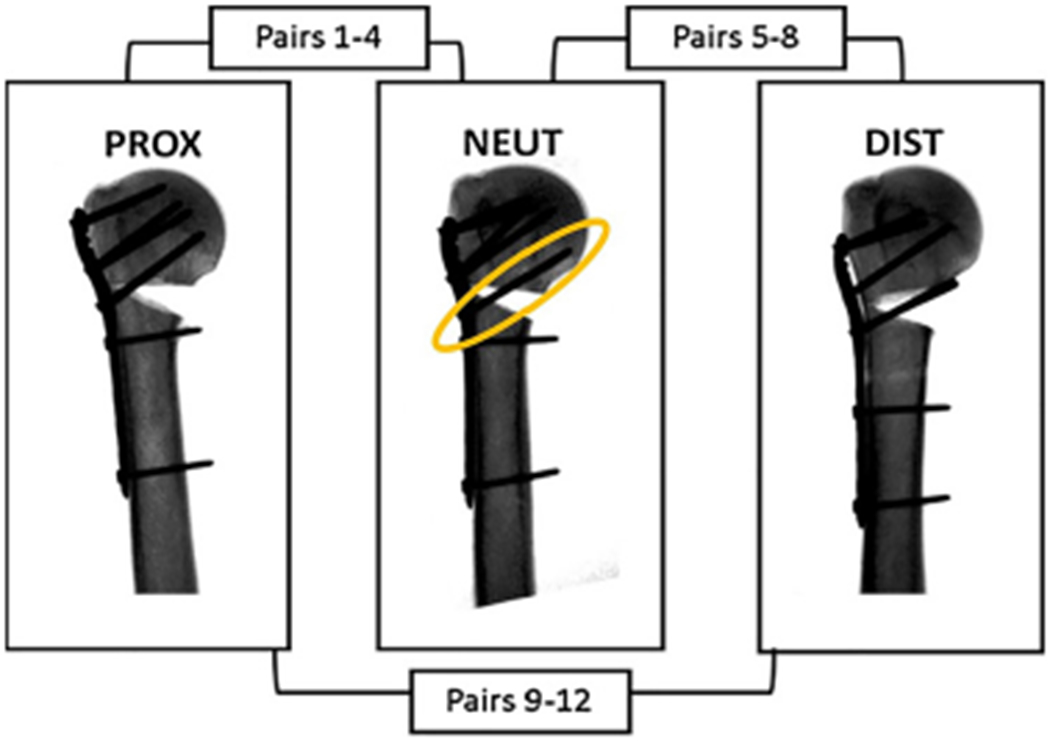
Fig. 1.

A schematic of the distribution of matched pairs between the proximal, neutral, and distal groups for cadaveric testing. Fluoroscopic images represent how changes in plate placement affect screw purchase into the calcar (circled in yellow). (For interpretation of the references to colour in this figure legend, the reader is referred to the web version of this article.)
