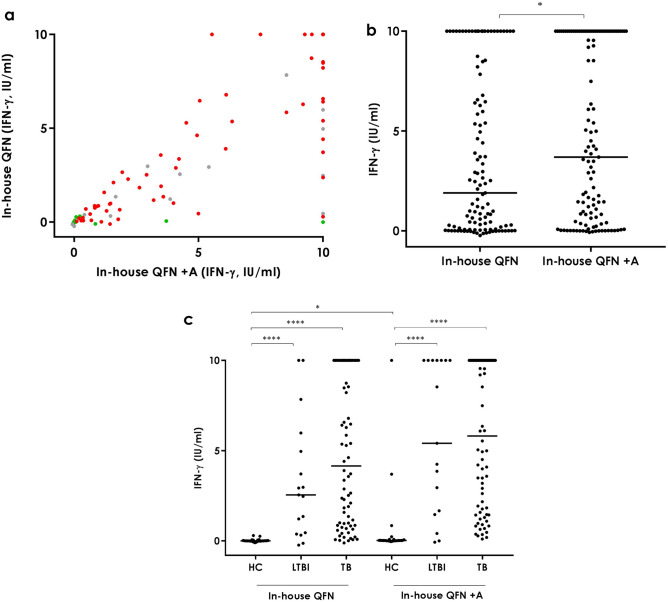
Figure 2.
Antigen-specific IFN-γ release in the in-house QFN and in-house QFN + A tubes. a Overall correlation. Spearman r = 0.86. Green circles correspond to healthy controls, grey to LTBI individuals and red to active tuberculosis patients. b Overall. Median and interquartile range (IQR) values: 1.9 IU/ml (0.07–7.84) for the in-house QFN and 3.7 IU/ml (0.41–10.00) for the in-house + A. c Per groups. Median and interquartile range (IQR) values: 0 IU/ml (-0.01–0.035), 2.55 IU/ml (0.415–5.47) and 4.155 IU/ml (0.86–10) for the in-house QFN in HC, LTBI and TB groups, respectively; and 0.02 IU/ml (0.01–0.075), 5.41 IU/ml (1.565–10) and 5.815 IU/ml (1.55–10) for the in-house QFN + A in HC, LTBI and TB groups, respectively HC: healthy controls, LTBI: latent tuberculosis infection, TB: active tuberculosis. Differences between groups were analysed using Mann–Whitney U test (*p < 0.05, ****p < 0.0001).

