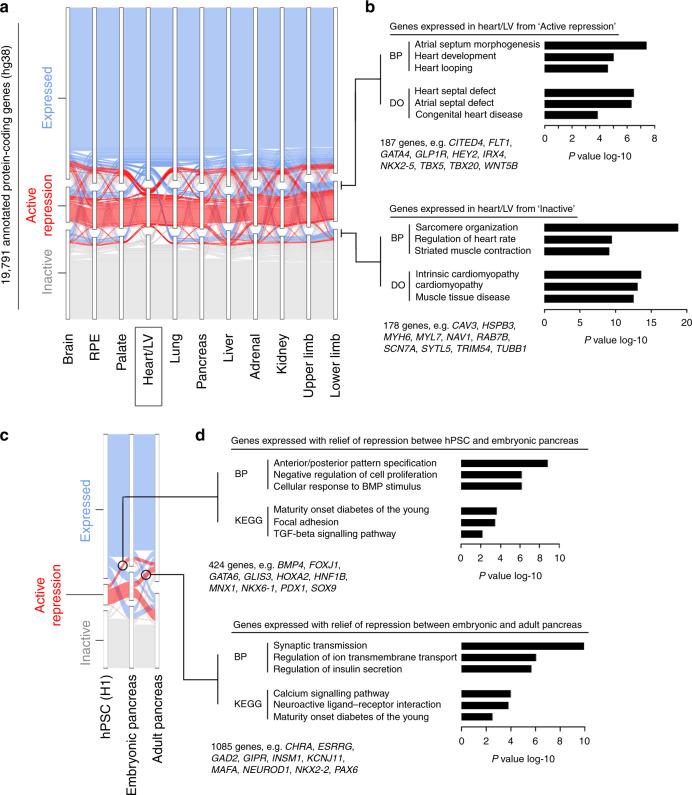
Fig. 3. Integration of promoter states across tissues and over time.
a Alluvial plot showing promoter state for 19,791 annotated genes across all tissues with replicated datasets. To aid visualisation, all the different transcribed states are amalgamated into a single expressed category (the alluvial plot for all individual states is shown in Supplementary Fig. 6). The example shown is centred on the promoter state in the Heart/LV dataset. Those genes with an expressed promoter state in the heart and either active repression or inactive elsewhere are indicated to the right of the panel and subject to gene enrichment analyses in (b). b Gene enrichment analysis of genes with an expressed promoter state in the heart and either active repression or inactive in all remaining tissues. All remaining genes were used as background. Examples of the genes underlying the biological process (BP) or disease ontology (DO) terms and their total number are listed beneath the bar charts. c Alluvial plot showing the variance in promoter state between H1 human pluripotent stem cells (hPSCs), the embryonic pancreas (prior to endocrine differentiation24) and the adult pancreas. Circles capture those genes that shift from active repression to expressed at the stage of either embryonic or adult pancreas. d Gene enrichment analyses of encircled genes from (c). Examples of the genes underlying the BP and KEGG terms and their total number are listed beneath the bar charts. All remaining genes were used as background. While maturity onset diabetes of the young emerged in both analyses, the underlying genes were different reflecting developmental roles prior to or after pancreatic endocrine differentiation24.

