Figure 5.
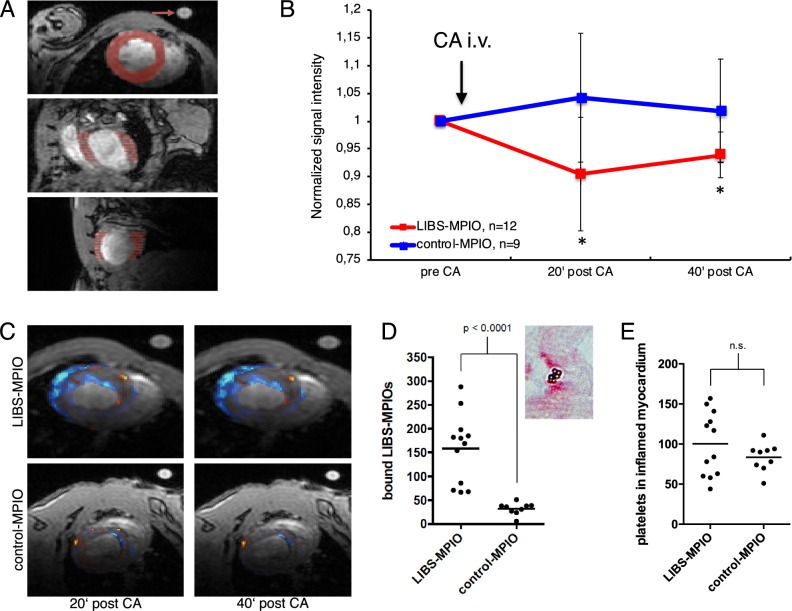
(A) Visualization of the signal quantification method. The signal in 20 periodically chosen slices of the myocardium was normalized to a 1% agarose reference probe and the pre-contrast agent scan. The reference probe is highlighted with a red arrow. (B) After injection of LIBS-MPIO a signal decrease was observed. The signal differed significantly from control-MPIO injected mice 20 and 40 min after injection. Animal numbers LIBS-MPIO: n = 12, control-MPIO: n = 9. (C) Visualization of the signal decrease in LIBS-MPIO injected mice (upper row) and control-MPIO injected mice (lower row). Blue indicates a lower signal in the myocardium compared to the pre contrast agent scan. (D) Histological counting of MPIOs in the myocardium showed significantly higher numbers of LIBS-MPIOs compared to control-MPIOs. (E) Platelet count was similar in both groups.

