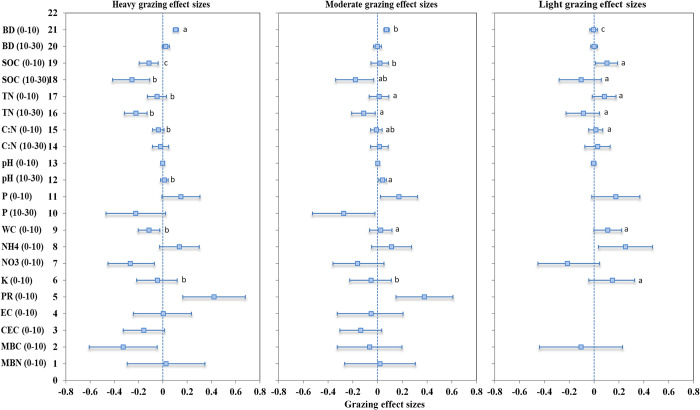
Fig 3. Global grazing effect sizes of 15 soil properties under 3 grazing intensities at 2 soil depths.
Bars represent the means and their ranges of 90% confidence intervals (CIs). The vertical dashed line was drawn at the grazing effect size = 0. Means within the same row followed by different small letters are significantly different at P<0.10 for the grazing intensities.

