Fig 7.
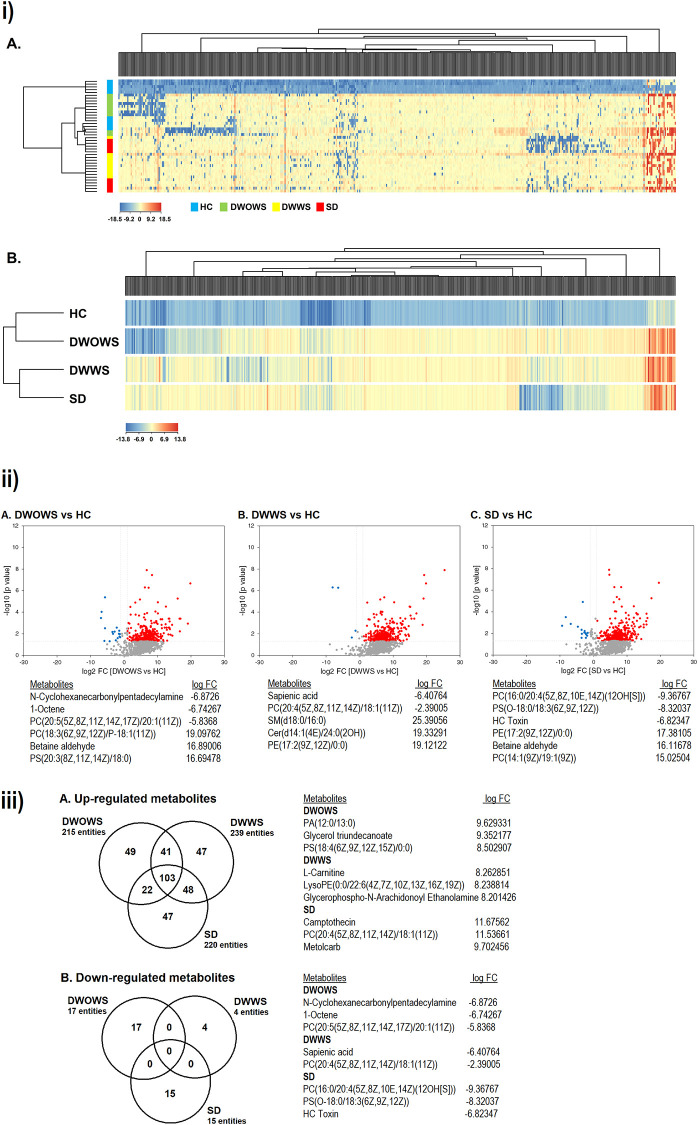
i) Hierarchical complete linkage clustered heat map of 500 metabolites met the requirement of FC > 2.0 and p < 0.05. Clustering based on individual samples (A) and categories (B) revealed the similarity as well as the differential metabolic expression in HC/DWOWS and DWWS/SD. ii) Volcano plot comparing p value against fold change of (A) DWOWS, (B) DWWS and (C) SD as compared to HC, and the top regulated metabolites in each category. A higher number of metabolites were up-regulated in dengue patients from all three categories compared to down-regulated metabolites. iii) Venn diagrams of (A) up-regulated and (B) down-regulated metabolites in DWOWS, DWWS and SD as compared to HC, and the top regulated metabolites in each category. DWOWS, DWWS and SD shared high commonality in the up-regulated metabolites, however, no metabolite was commonly down-regulated in all the categories.

