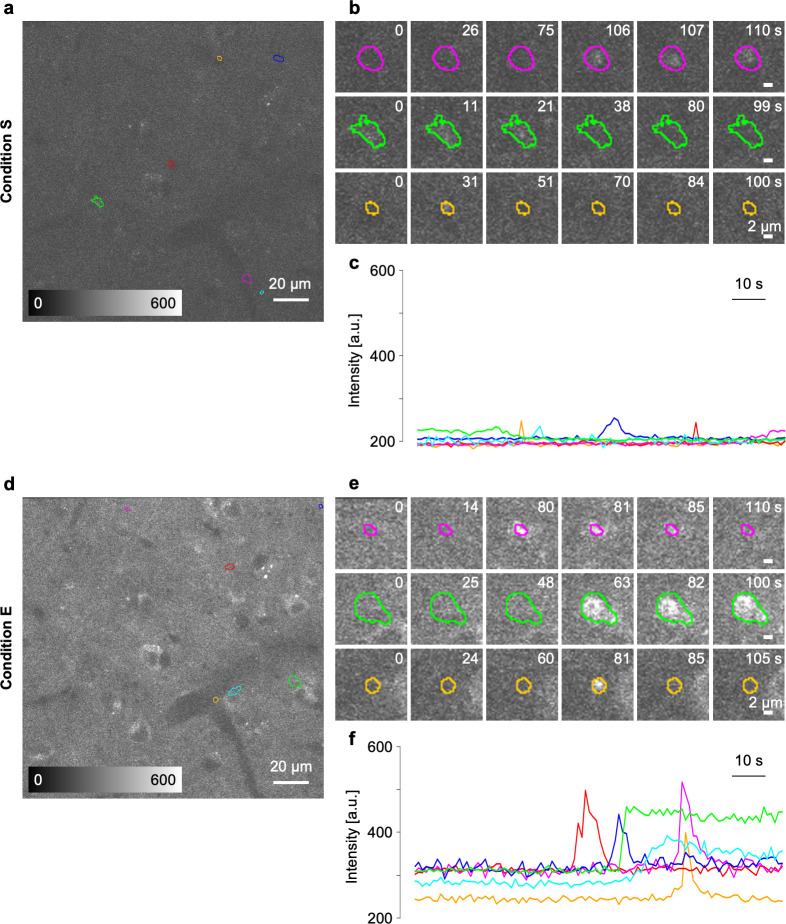
Fig 6. Two-photon imaging of spontaneous Ca2+ activities of cortical layer V astrocytes under condition E.
(a, d) Fluorescence images of G7NG817-line mouse cortical layer V obtained in the same field of view under (a) condition S and (d) condition E. The colored region of interests (ROIs) show the activated area detected computationally. (b, e) Examples of dynamics of fluorescence intensity derived from the spontaneous activity in the automatically set ROIs. (c, f) The time course of fluorescence intensity in the ROIs. The scale bars in (a, c) and (b, d) represent 20 and 2 μm, respectively.

