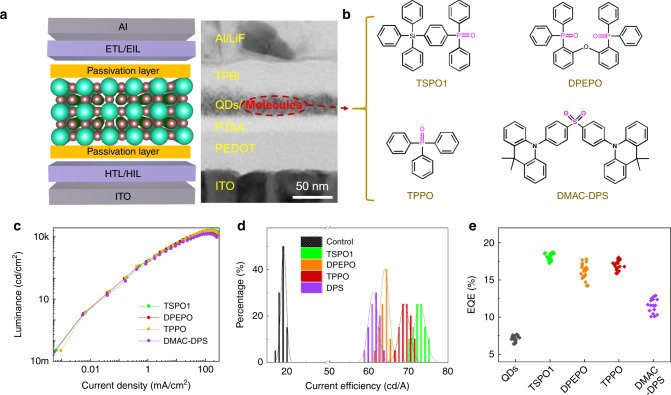
Fig. 5. EL performance of passivated QLED with various molecules.
a The schematic diagram and sectional TEM image of device structure with bilateral passivation, the scale bar is 50 nm. b The molecular structure of the used passivation molecules, TSPO1, DPEPO, TPPO and DMAC-DPS. c The luminance vs. current density curves (d) current efficiency distribution histogram and (e) EQE statistics of devices passivated by TSPO1, DPEPO, TPPO, and DMAC-DPS. Source data are provided as a Source Data file.

