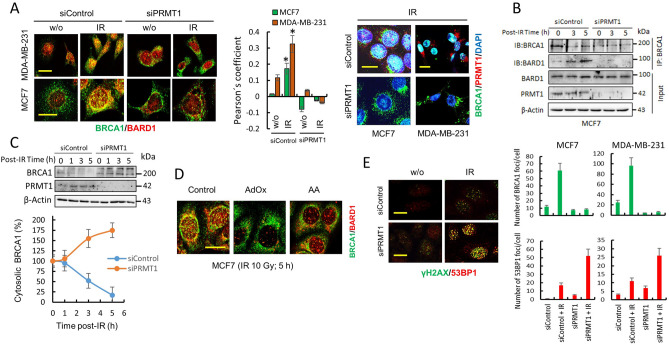
Figure 4.
PRMT1 controls the cellular localization of BRCA1 and facilitates DNA homologous recombination. (A) The effect of IR (10 Gy) on the localization of BRCA1 and BARD1 in controls and PRMT1-depleted breast cancer cells. Analysis of these proteins was performed using confocal microscopy at 5 h post IR. From the confocal images, a Pearson coefficient was calculated to estimate the degree of colocalization of BRCA1 (clone MS110) with BARD1 (histogram). The Pearson overlap coefficients are represented as the average of 10 individual cells. *P < 0.05 with respect to untreated control cells. The scale bars (10 μm) refer to both panels. Efficient PRMT1 silencing is observed in the right panel (Bars, 15 μm). (B) BRCA1 and BARD1 interaction after IR treatments (10 Gy) was determined by immunoprecipitation assays. Total extracts of MCF7 were immunoprecipitated with an anti-BRCA1 antibody (clone 6B4) and immunoblotted with indicated antibodies. (C) Time course of cytosolic BRCA1 in siControl- and siPRMT1-transfected MCF7 cells after IR (10 Gy). Cytosolic lysates (20 µg of total protein per well) were separated using SDS-PAGE and immunoblotted with the indicated antibodies. Cytosolic BRCA1 in western blot membranes was calculated by densitometry and referred to cytosolic BRCA1 in non-irradiated controls (100%) after correction by the amount of β-actin. Error bars show mean ± SD of three independent experiments. (D) The effect of AA and AdOx on BRCA1/BARD1 foci formation in MCF7 cells. Scale bar, 10 μm. (E) The effect of IR (10 Gy; 5 h) on the localization of γH2AX and 53BP1 in controls and PRMT1-depleted MCF7 cells. The histograms demonstrate the quantification of the cells that were positive for BRCA1 (from A) and 53BP1 foci under specified conditions. Cells with positive BRCA1 and 53BP1 foci were evaluated in at least 10 fields at × 960 magnification. Scale bars, 10 μm. The groupings blots in this figure were cropped from different gels. Full blots are shown in the Supplementary Information, Fig. S7.

