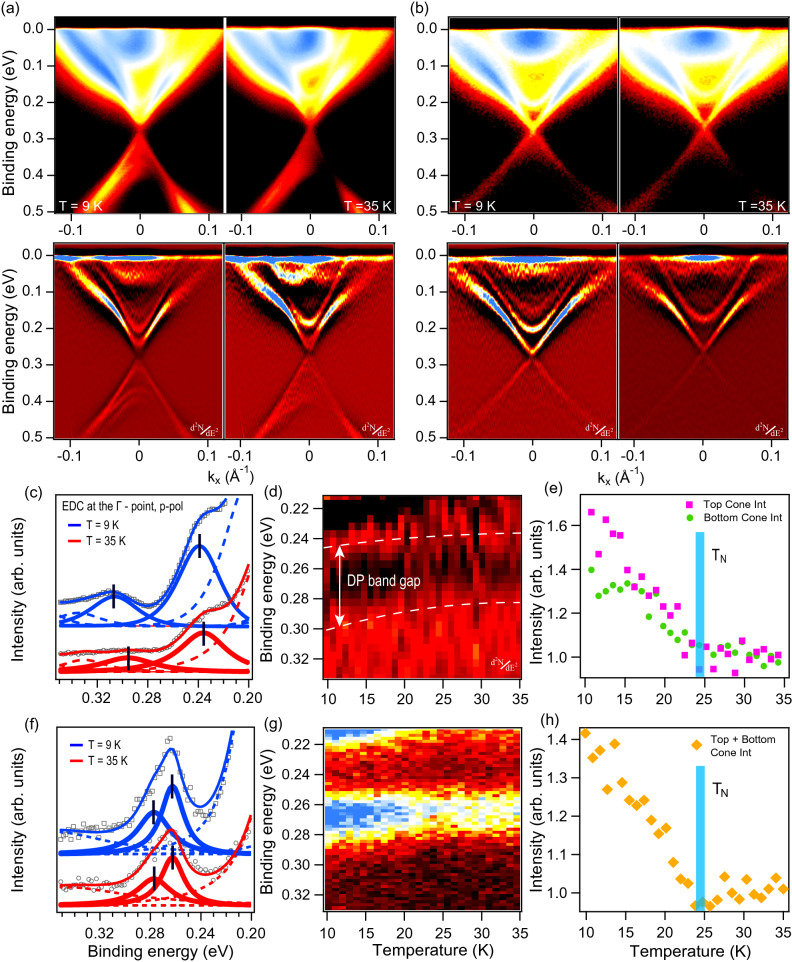
Figure 1.
(a,b) upper line—ARPES dispersion maps measured for at photon energy 6.3 eV using p-polarized laser radiation below (9 K) and above (35 K) for the sample with a large (a) and reduced gap (b). (a,b) lower line—the same as in the upper line but in the representation. (c) EDCs cut at the -point () in energy region around the DP for the “large gap” sample at 9 K (blue curves) and 35 K (red curves) with corresponding spectral decompositions. The modification of the DC structure near the DP under gradual increase of temperature between 9 and 35 K shown as a set of EDCs at the -point (d) and as integrated intensity of corresponding EDCs in the energy intervals corresponding to the upper (pink) and lower (green) DC parts (e). (f–h) The same as in panels (c–e) measured for sample with a “reduced gap”. Note that no distinction between the upper and lower parts of the DC is made in (h).

