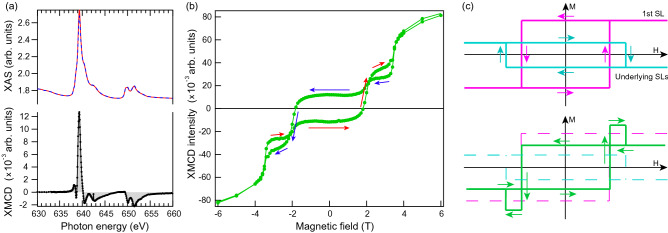
Figure 6.
(a, upper panel) X-ray Absorption Spectra (XAS), with blue and red curves corresponding to the opposite circular polarizations of SR and (a, bottom panel) XMCD spectrum, i.e. the difference of the two XAS. The measurements have been made in the total electron yield mode at Mn edge (630–660 eV) at 15 K in zero magnetic field. (b) XMCD amplitudes at the Mn edge plotted as a function of applied out-of-plane magnetic field (linear background is subtracted). Arrows show direction of the curve moving from − 6 to 6 T (red) and back (blue). (c) Schematic presentation of contributions from topmost SL (magenta) and underlying SLs with effective opposite magnetization (cyan) to the XMCD signal as well as the resulting curve (green).

