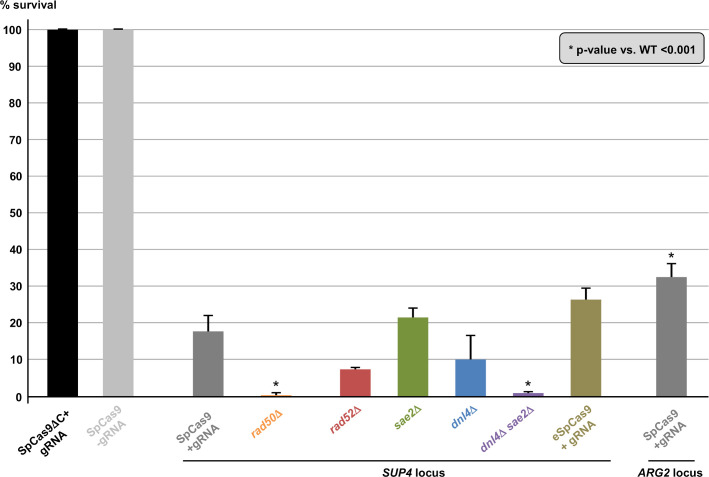
Fig 2. Yeast survival to Cas9 induction.
For each strain, the same number of cells were plated on galactose and glucose plates and the survival was expressed in CFU number on galactose plates over CFU number on glucose plates. The mean and the 95% confidence interval are plotted for each strain. Significant t-test p-values when compared to wild-type SpCas9 survival are indicated by asterisks. See Materials & Methods for statistics.

