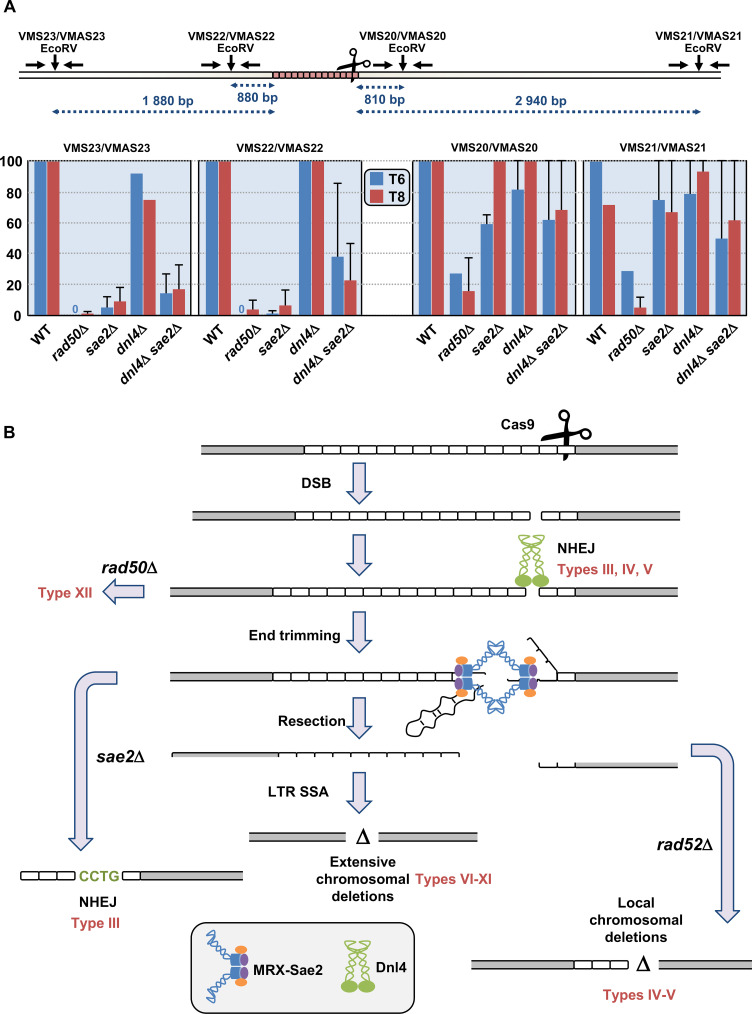
Fig 7. Quantification of double-strand break resection.
A: Couples of primers used to amplify each EcoRV site are indicated above and can be found in S3 Table. EcoRV sites are shown by vertical arrows. Resection graphs are plotted for each primer pair. Average relative values of resection as compared to the total DSB amount detected on Southern blots are shown at 6 hours (in blue) and 8 hours (in red), along with standard deviations. B: Mechanistic model for chromosomal deletions following a Cas9-induced DSB. See text for details. Resulting deletion types are indicated in red near each pathway.

