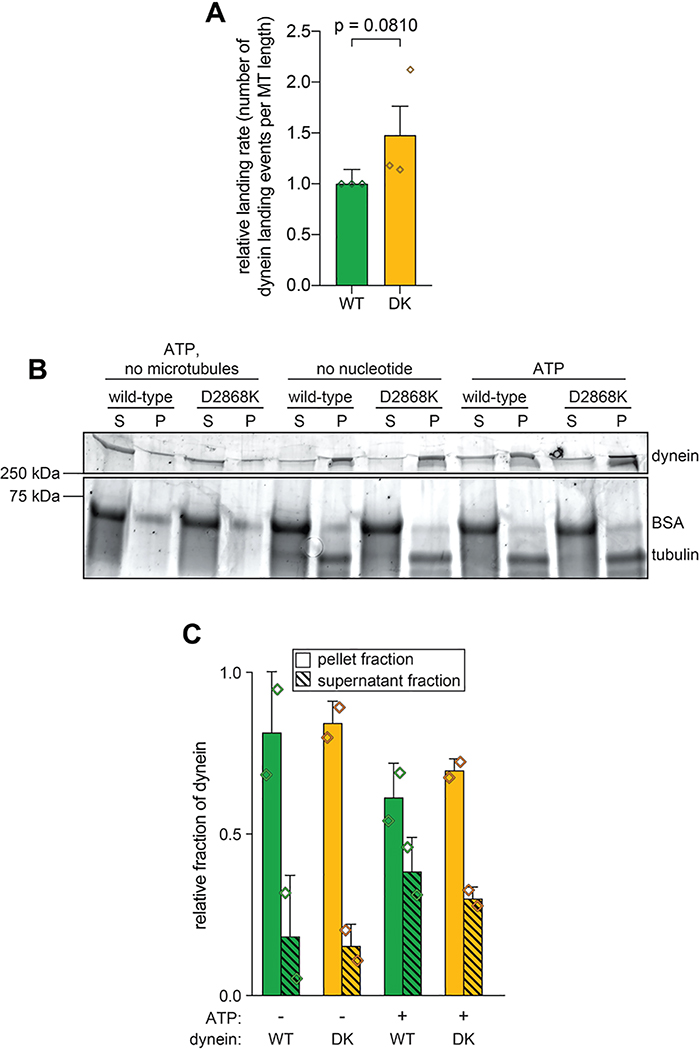
Extended Data Figure 4. Uninhibited dynein mutant exhibits only moderate increase in microtubule landing activity.
(A) Plots depicting relative microtubule landing rate of full length wild-type (WT) and D2868K (DK) dynein, as measured from single molecule motility experiments (mean ± standard deviation; n = 554 wild-type motors from 1532 μm of microtubules, and 553 D2868K motors from 1177 μm of microtubules; 3 independent experiments were quantitated for each). Diamonds represent mean normalized values obtained from each independent replicate experiment. Briefly, equivalent concentrations of full length wild-type or D2868K dynein were added to imaging chambers (after taking into account relative differences in labeling efficiencies, as determined from fluorescent scans of protein gels), and the number of moving motors were quantitated. Statistical significance was determined using a two-tailed Welch’s t test. (B and C) Representative gel (B; Sypro Ruby-stained) and quantitation (C) of microtubule co-sedimentation assay with full length wild-type (WT) and D2868K (DK) dynein done in the absence and presence of ATP (mean ± standard deviation; n = 2 independent experiments; diamonds represent values obtained from each replicate). Relative microtubule binding was determined by measuring background-corrected band intensities of each, and subtracting any non-specific microtubule-independent pelleting (as determined from experiment performed in the absence of microtubules).

