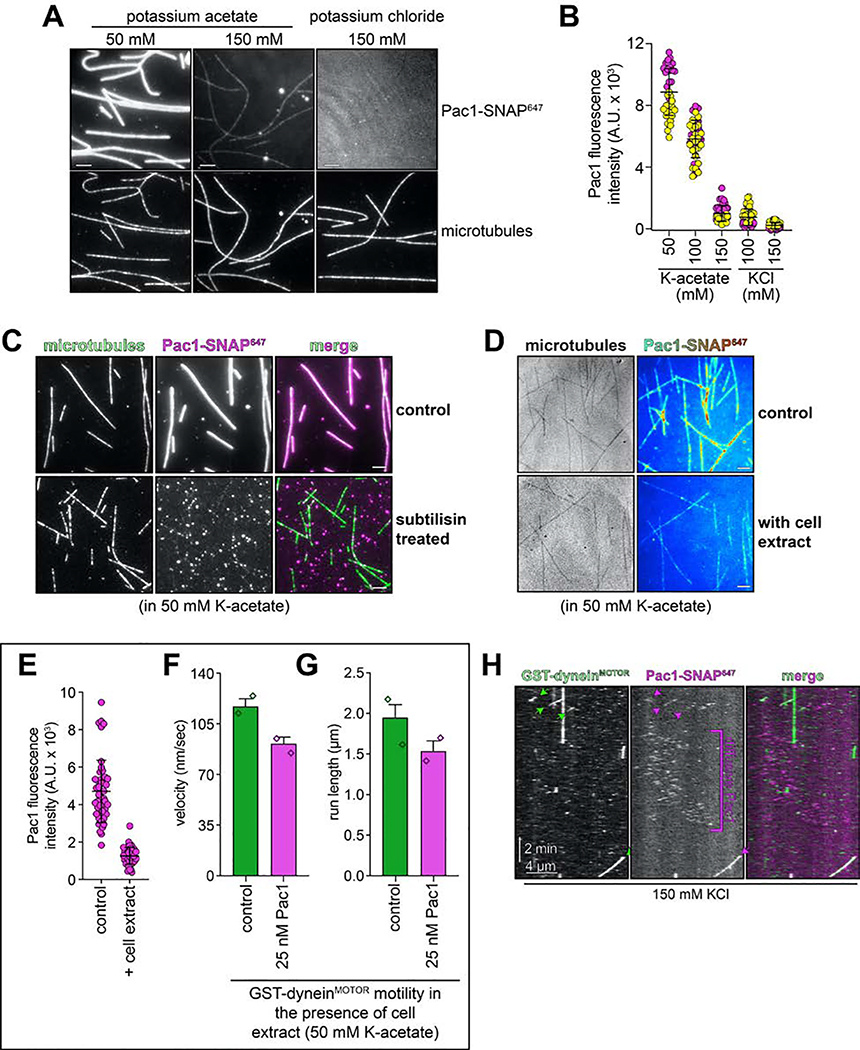
Extended Data Figure 6. Pac1-microtubule binding behavior, and its contribution to dynein activity.
(A and B) Representative images (A) and intensity scatter plots (B; bars depict mean ± standard deviation) of microtubule-bound Pac1 in different buffers. Pac1-SNAP647 diluted in motility buffer (50 nM, dimer concentration) with indicated salts was introduced into a chambers with coverglass-adhered microtubules, and images were acquired (yellow and magenta circles represent data acquired from each independent experiments; n = 38, 49, 41, 49, and 45 microtubules that span 911 μm, 1074 μm, 1077 μm, 906 μm, 1017 μm in length for each condition, left to right). (C) Pac1-microtubule binding is reduced after enzymatic removal of the unstructured tubulin carboxy-terminal tails (see Methods; similar results were obtained from 2 independent experiments). (D - G) Addition of cell extracts reduces Pac1-microtubule binding, and attenuates Pac1-mediated dynein velocity reduction. Representative fluorescence images of Pac1-SNAP647 on microtubules (D; Pac1-SNAP647 shown as a heat map) and scatter plots depicting intensity values (E; bars depict mean ± standard deviation; n= 48 and 47 microtubules that span 890 μm and 841 μm in length for each condition, left to right; similar results were obtained from 2 independent experiments). (F and G) Plots depicting the motility properties for GST-dyneinMOTOR in the absence and presence of 25 nM Pac1 (dimer concentration) in low ionic strength buffer (50 mM potassium acetate) in the presence of cell extracts (0.96 mg/ml final; 275 and 258 motors, left to right, from 2 independent experiments were quantitated). Note the small Pac1-mediated GST-dyneinMOTOR velocity reduction in the presence of cell extracts (22.1%, compared to 69.5% in the absence of extracts). (H) Additional representative kymograph of GST-dyneinMOTOR comigrating with Pac1 in buffer with 150 mM KCl (see Fig. 6D and Extended Data Fig. 7E – G for quantitation and statistics). Note the diffusive behavior of Pac1 on microtubules. Scale bars in panels A, C and D, 4 μm.

